Objects
Drawable objects are added to plot windows with kaxe.Window.add(). Charts use their own data APIs instead.
See Recipes for worked examples and Legends and Titles for legend() usage.
Object methods
Several objects expose chainable methods before add():
Object |
Methods |
Purpose |
|---|---|---|
|
Shade under a curve; draw a tangent line |
|
|
Set legend label and symbol |
|
|
Custom legend entry per object |
Example:
import math
f = kaxe.Function(lambda x: math.sin(x))
f.fill(-math.pi, math.pi)
f.tangent(1)
plt.add(f)
Smart objects
Smart objects adapt to the plot type (2D or 3D) based on the window you add them to — similar to method overloading.
- class kaxe.Points(x, y, z=None, **kwargs)
Points to be added to any plot type
- Parameters:
x (array-like) – X coordinates of the points.
y (array-like) – Y coordinates of the points.
**kwargs – Additional keyword arguments. For the appropiate keyworks see arguments for Points2D and Points3D.
show_points,dashed, anddottedare supported by Points2D only (dashed/dottedrequireconnect=True).
- Returns:
Object – Correct points class based on the parameters
- Return type:
See also
- class kaxe.Function(f: Callable, color: tuple = None, width: int = 10, numPoints: int = None, fill: bool = True, *args, **kwargs)
Function to be added to any plot type
- Parameters:
f (Callable) – The function to be plotted. Should accept one parameter for 2D functions and two parameters for 3D functions.
color (tuple, optional) – The color of the function plot. Default is None.
width (int, optional) – The width of the function plot line for 2D functions. Default is 10.
numPoints (int, optional) – The number of points to plot for 3D functions. Default is None.
fill (bool, optional) – Whether to fill the area under the function plot for 3D functions. Default is True.
domain (tuple, optional) – Sampling interval for auto-scaled axes. See
kaxe.Function2Dandkaxe.Function3D.range (tuple, optional) – Fixed output interval on the dependent axis when auto-scaling.
*args (tuple) – Additional positional arguments to pass to the function f.
**kwargs (dict) – Additional keyword arguments to pass to the function f.
- Returns:
Object – Correct Function class based on the parameters
- Return type:
See also
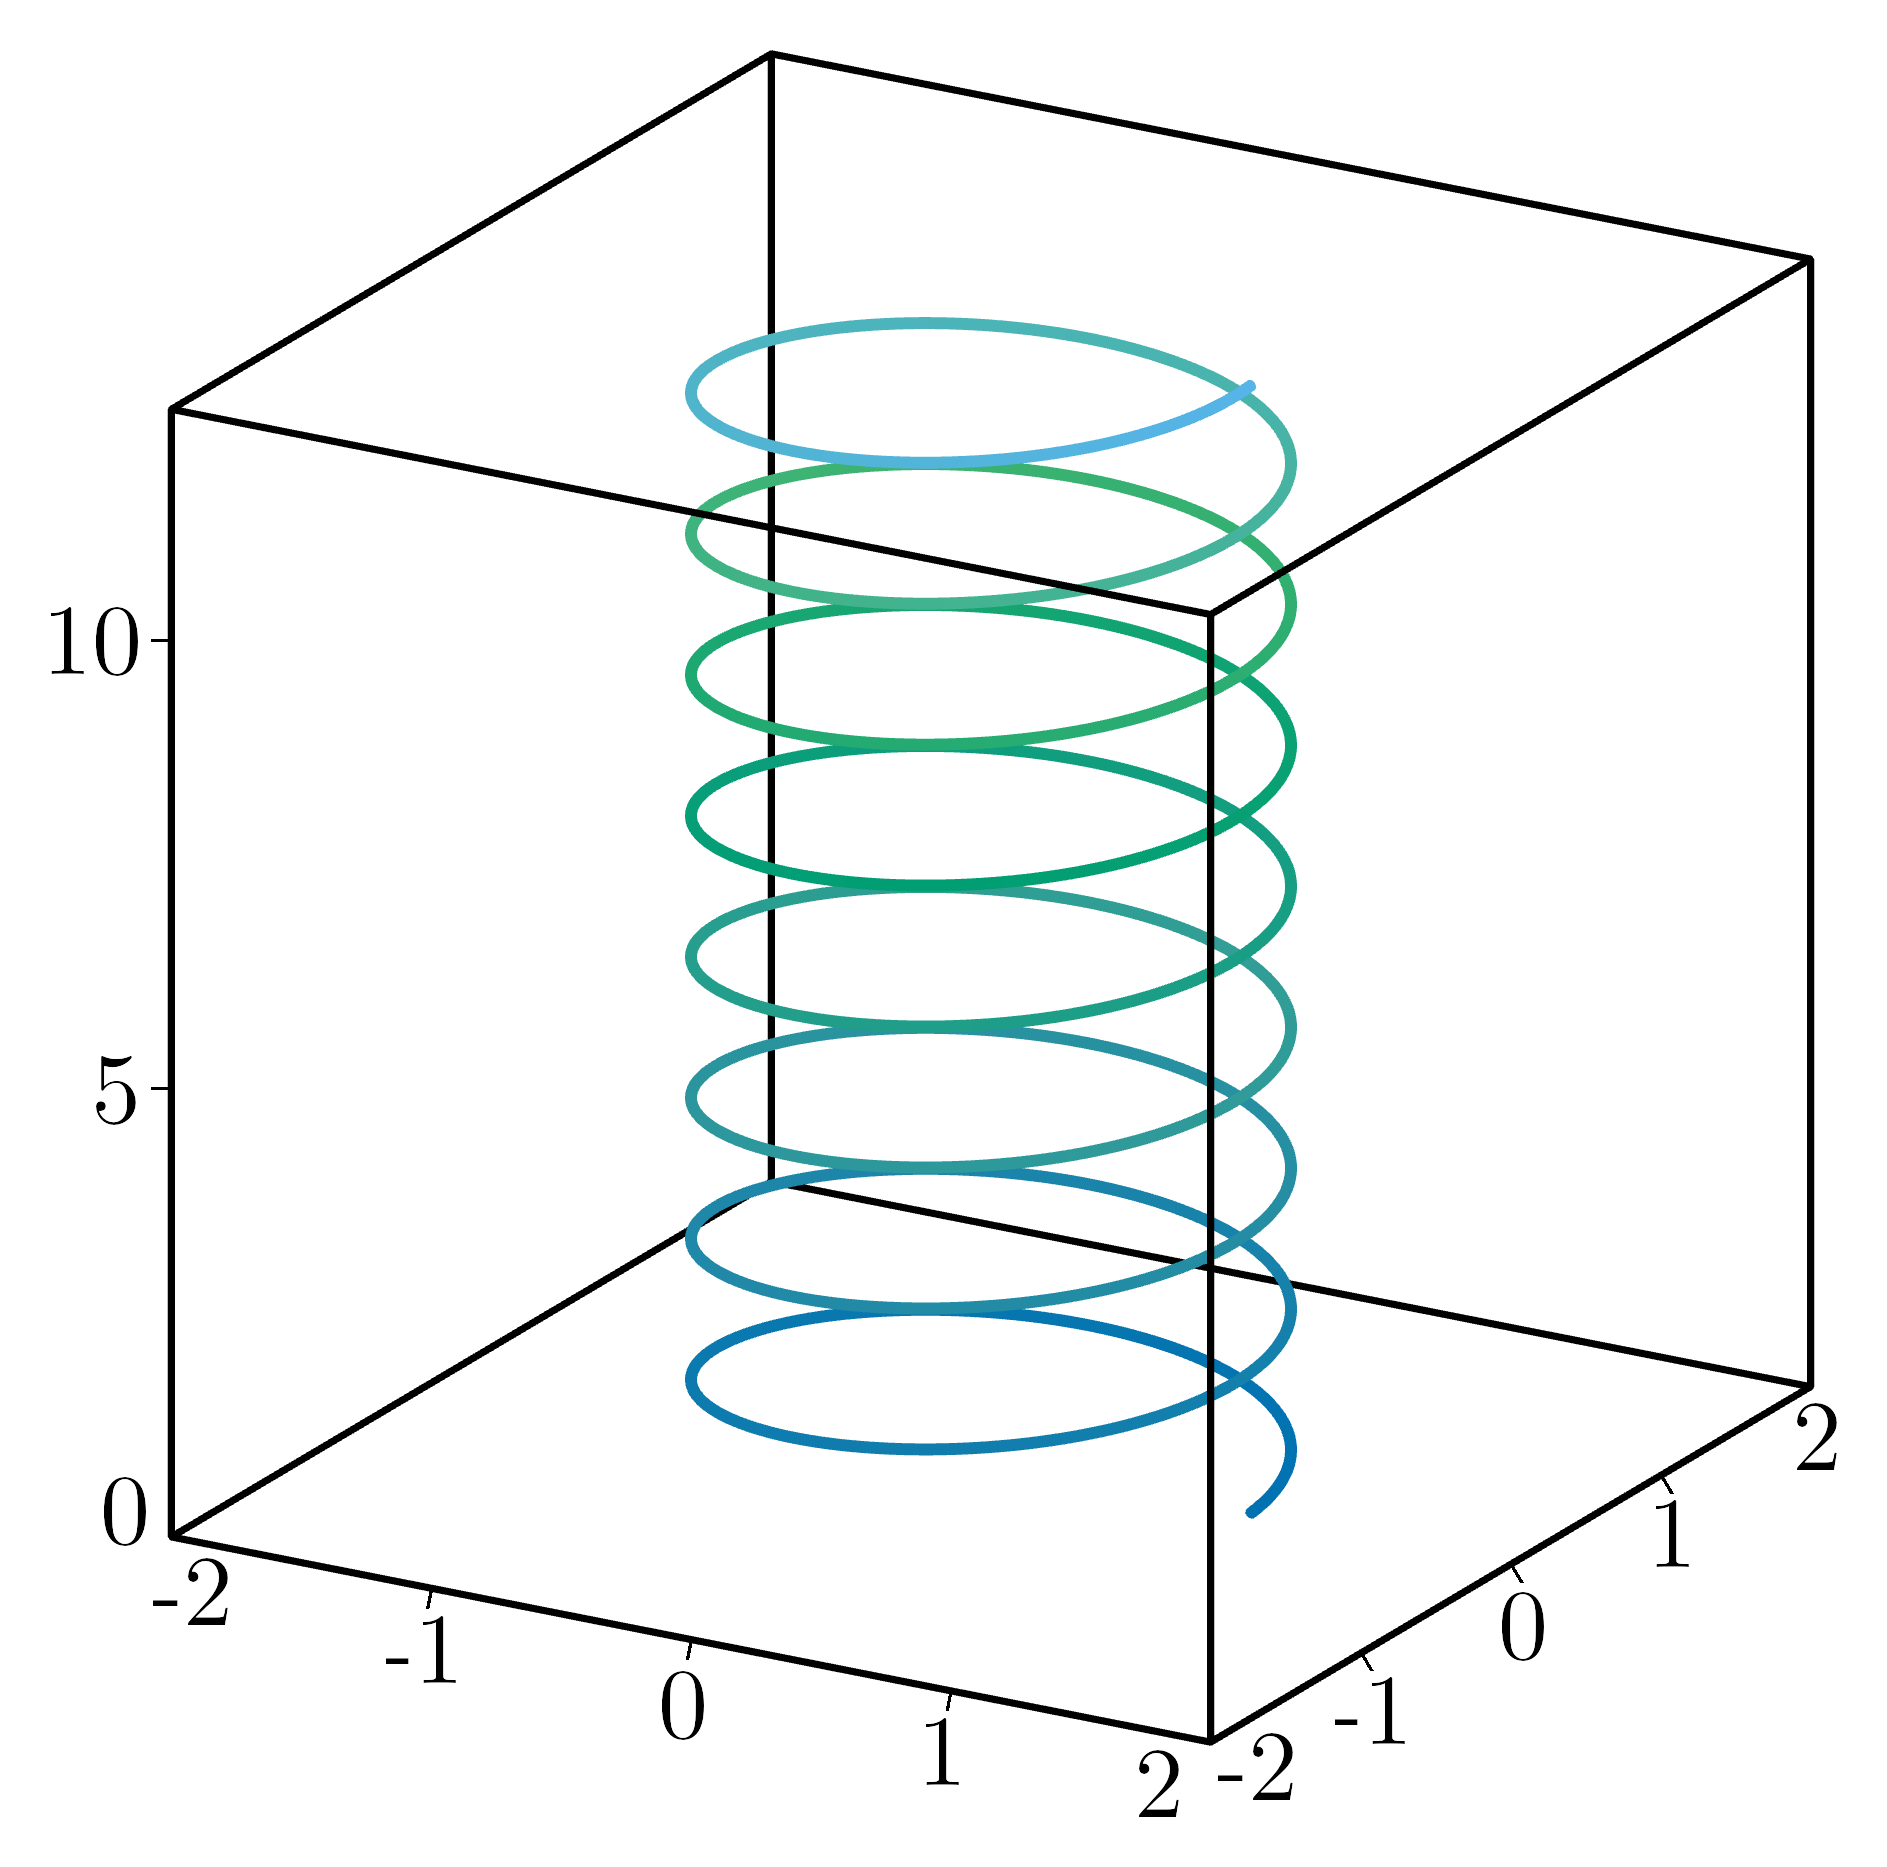
- class kaxe.ParametricEquation(f: Callable, interval: tuple | list, color: tuple = None, width: int = 10, dashed: int = 0, dotted: int = 0, *args, **kwargs)
A class to represent a parametric equation.
Supports classical plots, polar plot is experimential
- Parameters:
f (Callable) – The parametric function.
interval (Union[tuple, list]) – The interval over which the function is defined.
color (tuple | kaxe.Colormap, optional) – The color of the parametric equation, by default None. ColorMap only works in 3D plots.
width (int, optional) – The width of the line representing the parametric equation, by default 10.
dotted (int, optional) – If greater than 0, the function plot line will be dotted with the specified distance between dots. Default is 0.
dashed (int, optional) – If greater than 0, the function plot line will be dashed with the specified distance between dashes. Default is 0.
*args (tuple) – Additional positional arguments.
**kwargs (dict) – Additional keyword arguments.
- legend(text: str, symbol='LINE', color=None)
Adds a legend
- Parameters:
text (str) – The text to be displayed in the legend.
symbol (symbols, optional) – The symbol to be used in the legend.
color (optional) – The color to be used for the legend text. If not provided, the default color will be used.
- Returns:
self – Returns the instance of the arrow object with the updated legend.
- Return type:
object
- tangent(t, dt=1e-05)
Creates an tangent using central diffrence quotient Does not work on 3D plots
- Parameters:
t (int|float) – t-value where tangent will be placed
dt (int|float, optional) – Step size for CFDM
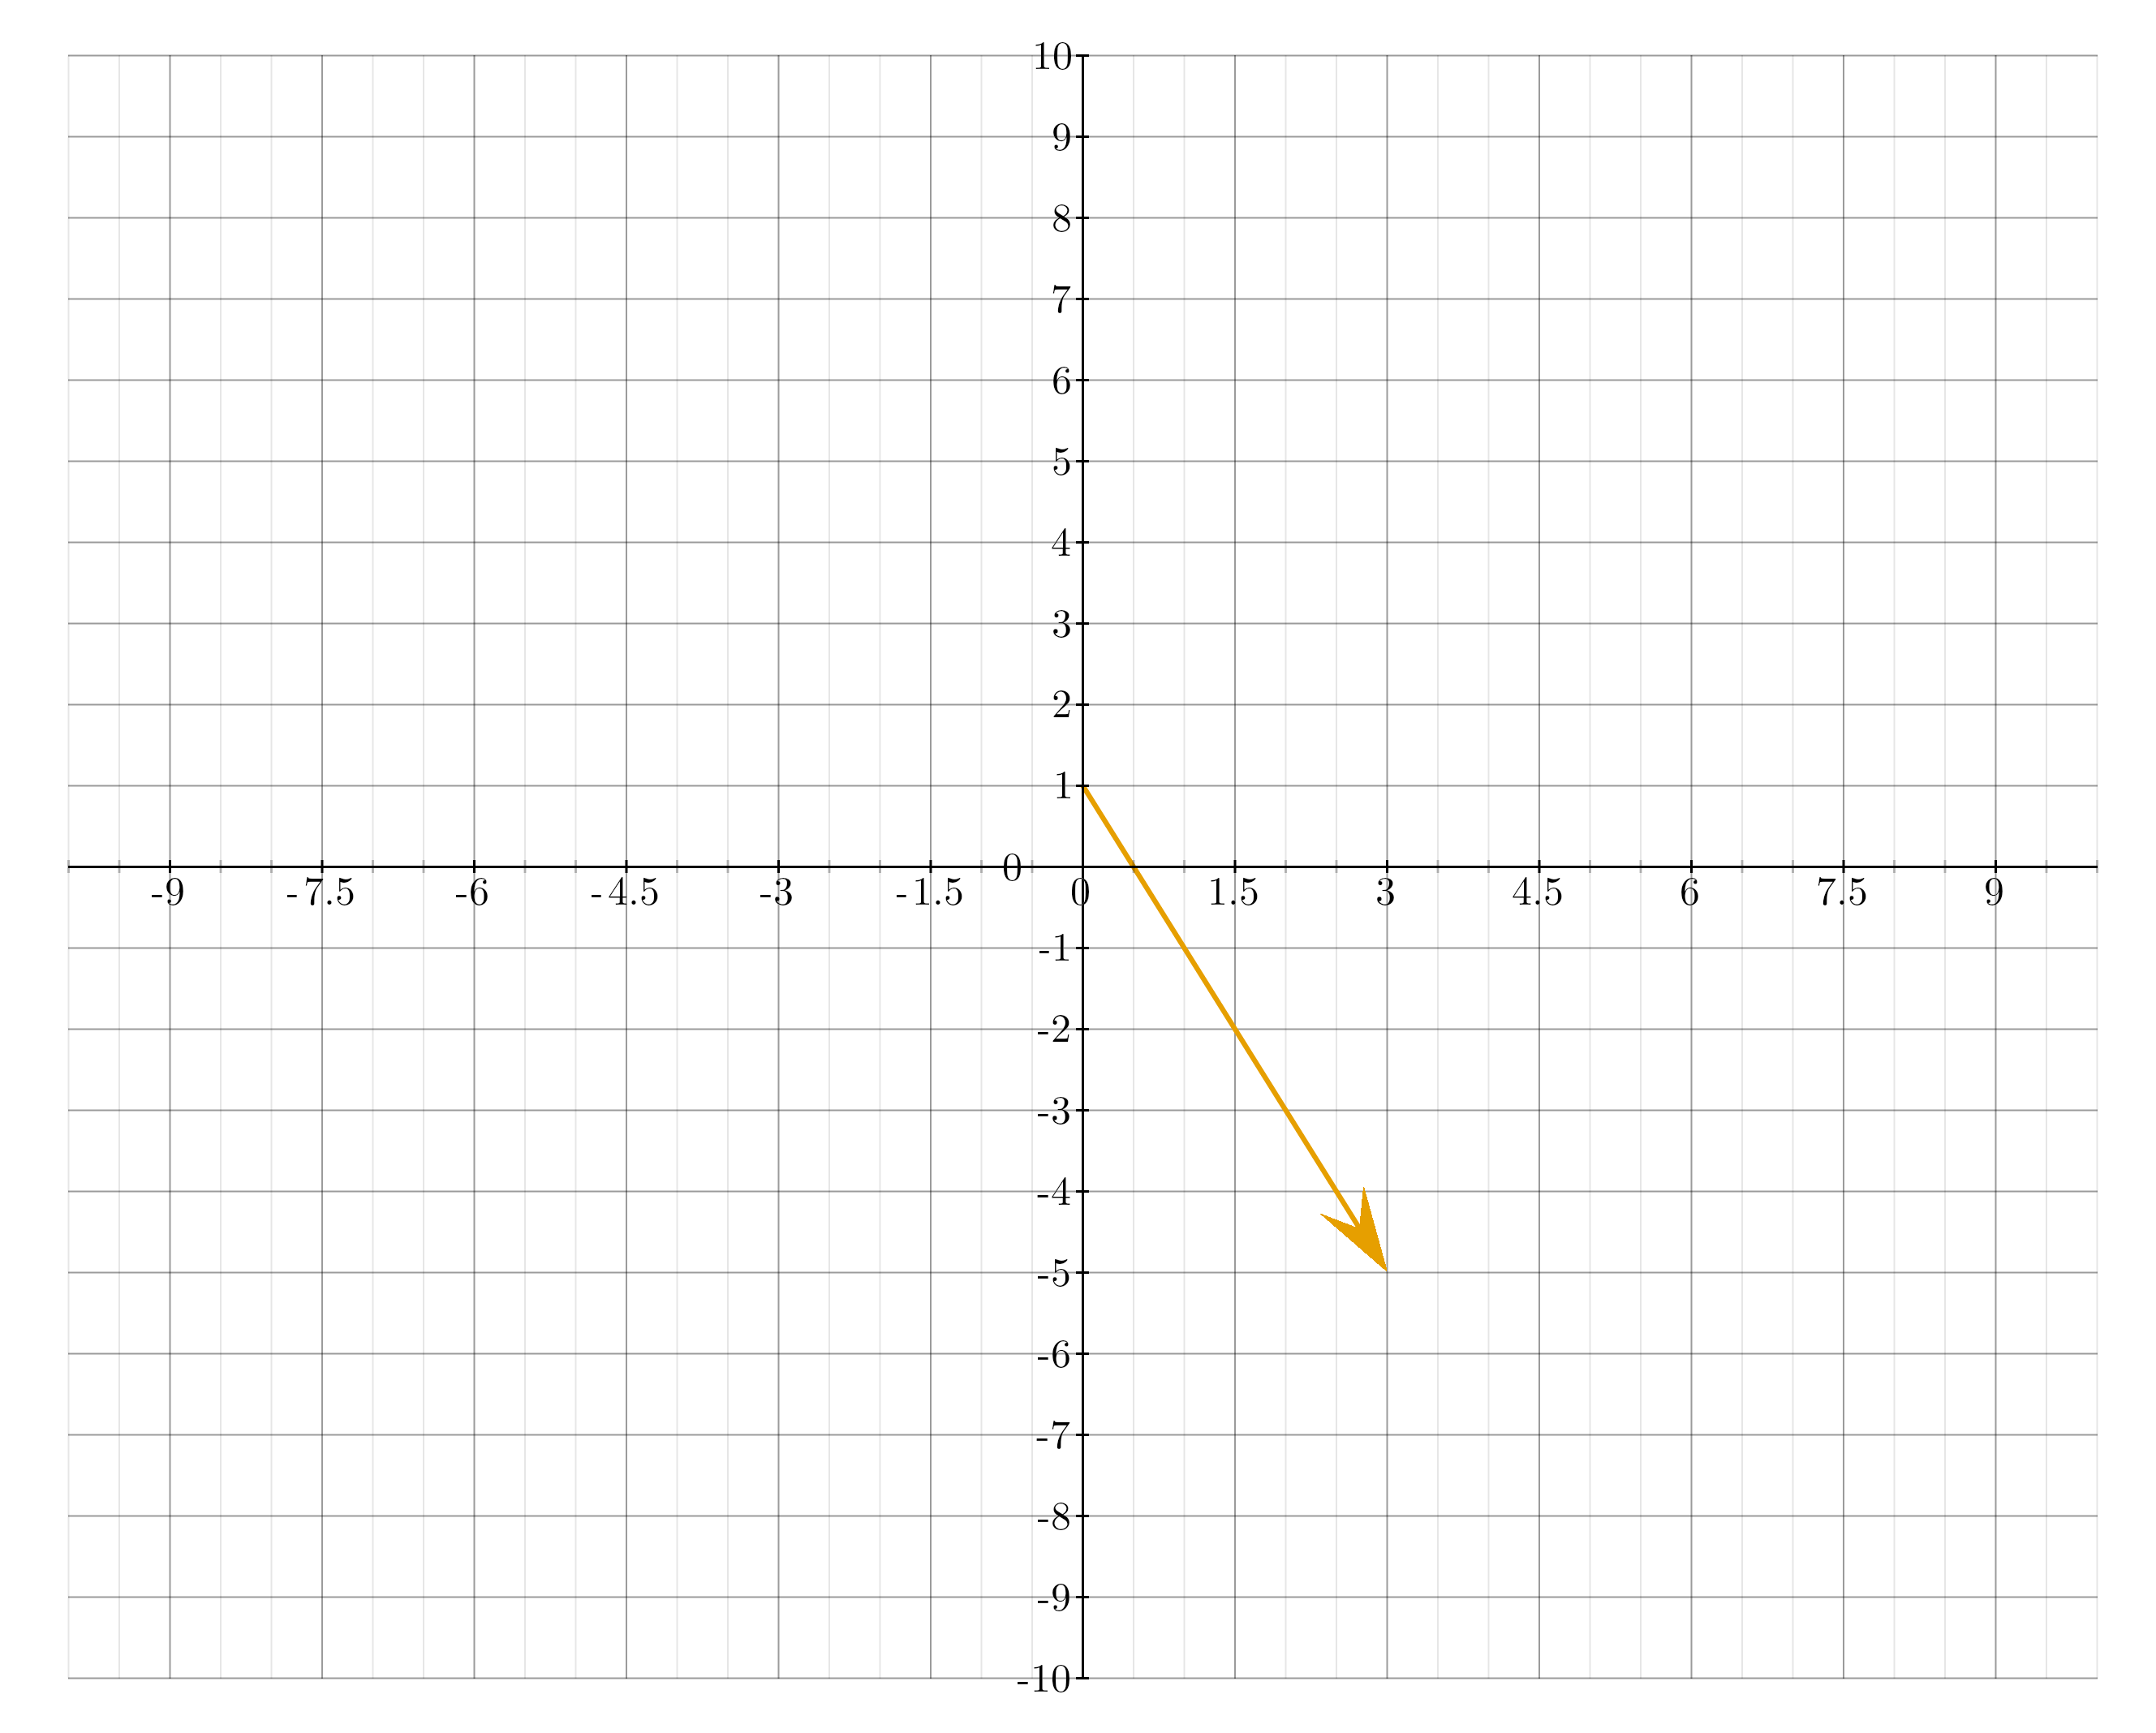
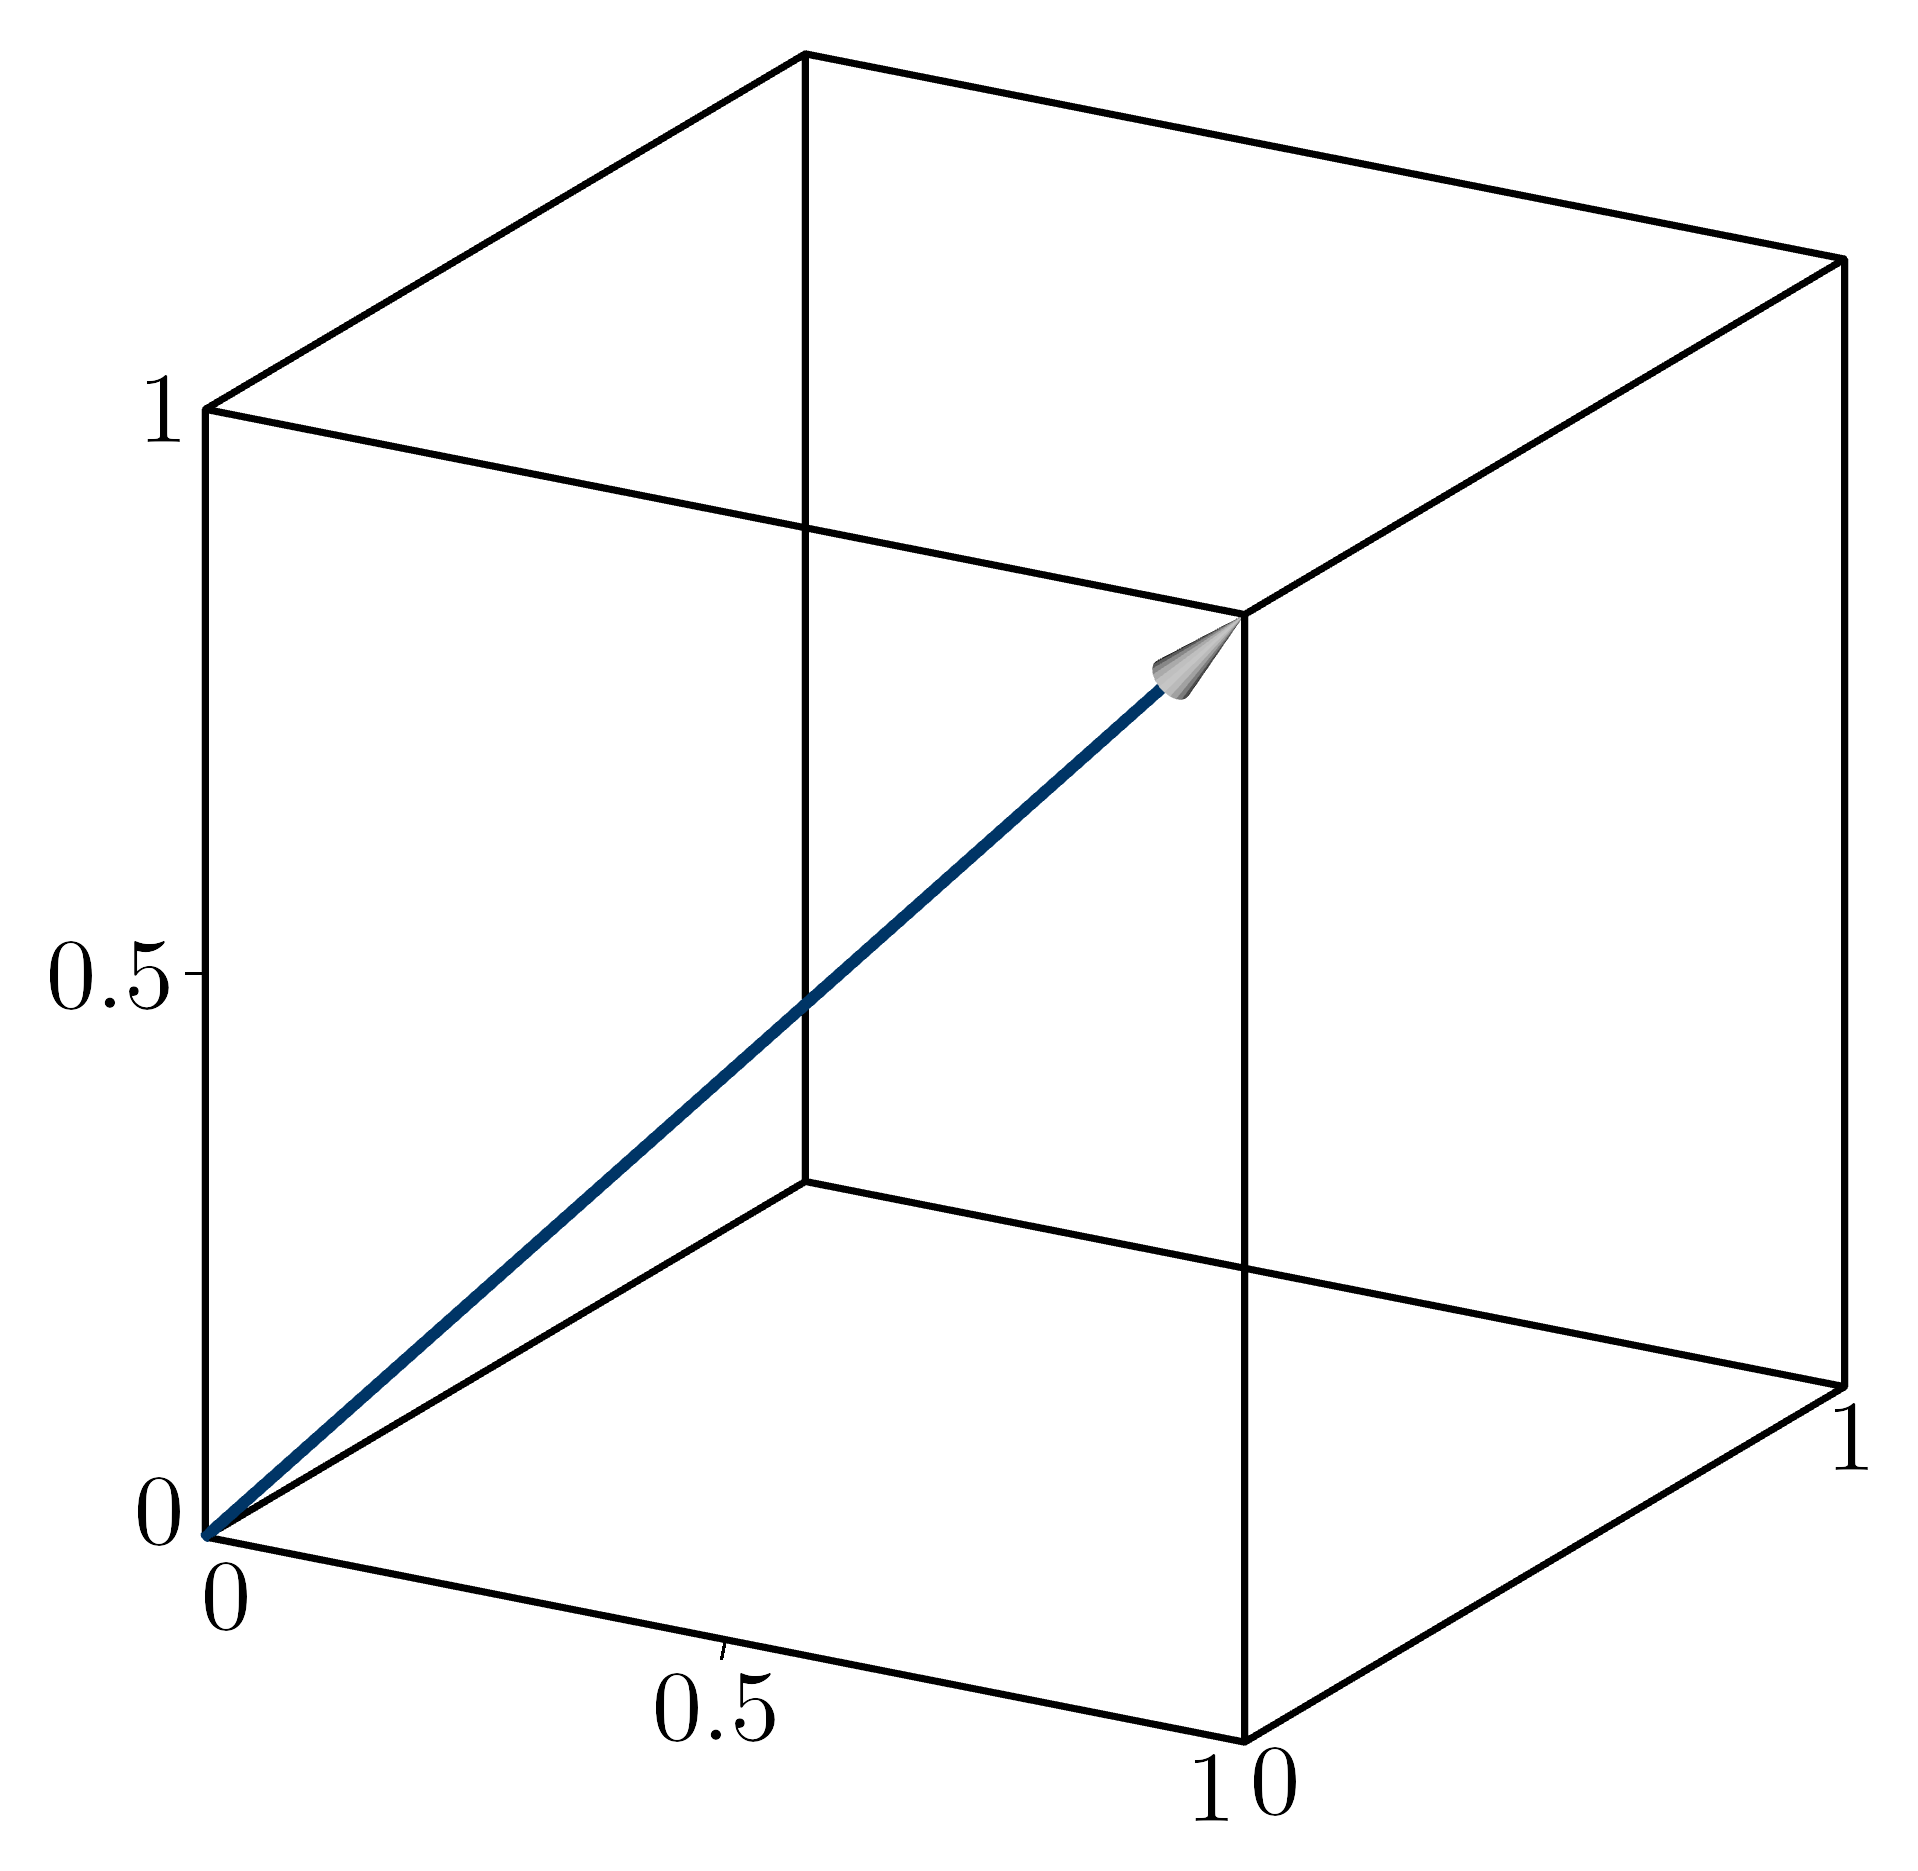
- class kaxe.Arrow(p0, p1, color: tuple = None, headSize: int = 42, lineThickness: int = 10)
A class to represent an arrow with customizable properties such as color, head size, and line thickness.
Supported in the classical plots
- Parameters:
p0 (tuple) – The starting point of the arrow.
p1 (tuple) – The ending point of the arrow.
color (tuple, optional) – The color of the arrow in RGBA format. If None, a random color is assigned (default is None).
headSize (int, optional) – The size of the arrowhead (default is 42).
lineThickness (int, optional) – The thickness of the arrow line (default is 10).
Examples
>> plt.add( kaxe.Arrow((0,0), (1,1)) )
- legend(text: str, symbol='LINE', color=None)
Adds a legend
- Parameters:
text (str) – The text to be displayed in the legend.
symbol (symbols, optional) – The symbol to be used in the legend.
color (optional) – The color to be used for the legend text. If not provided, the default color will be used.
- Returns:
self – Returns the instance of the arrow object with the updated legend.
- Return type:
object
- class kaxe.PolarGuideGrid(center=(0, 0), radii=None, angles=None, arc_span=None, radius_labels=False, angle_labels=False, radial_extent='plot', symmetric=True, dashed=False, dotted=False, dashed_dist=30, dotted_dist=30, color=None, width=None)
Polar-style guide overlay on a Cartesian plot.
Draws concentric circles or arcs and radial lines through a configurable center in data coordinates. Useful for s-plane root locus plots and other diagrams that combine Cartesian axes with polar guide geometry.
- Parameters:
center (tuple) – Guide origin
(x, y)in data coordinates. Default(0, 0).radii (list, optional) – Circle radii in data units.
Noneskips circles.angles (list, optional) – Radial line angles in degrees, CCW from +x.
Noneskips radials.arc_span (tuple, optional) –
(start_deg, end_deg)to draw partial arcs instead of full circles.radius_labels (bool or list, optional) –
Truelabels each radius at the negative-x intersection; or pass explicit strings aligned withradii.angle_labels (bool or list, optional) –
Truelabels each angle at the plot border; or pass explicit strings aligned withangles.radial_extent (str or float, optional) –
'plot'clips radials to the plot border; a float sets a fixed data length fromcenter.symmetric (bool, optional) – When
True, each angle also draws its mirror about the x-axis.dashed (bool, optional) – Draw guide lines dashed.
dotted (bool, optional) – Draw guide lines dotted.
dashed_dist (int, optional) – Pixel spacing between dashes.
dotted_dist (int, optional) – Pixel spacing between dots.
color (tuple, optional) – Line color. Defaults to
Marker.gridlineColor.width (int, optional) – Line width. Defaults to
Marker.gridlineWidth.
Examples
>>> plt = kaxe.Plot([-10, 2, -5, 5])
>>> plt.add(kaxe.PolarGuideGrid(
...     radii=[2, 4, 6, 8, 10],
...     angles=[120, 135, 150],
...     arc_span=(90, 270),
...     radius_labels=True,
... ))
2D objects
Use typed 2D objects when you need explicit control or parameters only available on the 2D class.
- class kaxe.Points2D(x, y, color: tuple = None, size: int = None, symbol: str = None, connect: bool = False, lollipop=False, show_points: bool = True, dashed: int = 0, dotted: int = 0)
Create points on 2D plane
- Parameters:
x (list or array-like) – The x-coordinates of the points.
y (list or array-like) – The y-coordinates of the points.
color (tuple, optional) – The color of the points in RGB format. If None, a random color is assigned.
size (int, optional) – The size of the points. Default is None.
symbol (str, optional) – The symbol used to represent the points. Default is None.
connect (bool, optional) – If True, the points will be connected by lines. Default is False.
lollipop (bool, optional) – If True, the points will be represented as lollipops. Default is False.
show_points (bool, optional) – If False, point markers are not drawn. With
connect=True, only the connector polyline is drawn. Default is True.dashed (int, optional) – If greater than 0, connected lines are dashed with the specified pixel spacing between dashes. Dense point sets are resampled to that spacing before rendering. Default is 0.
dotted (int, optional) – If greater than 0, connected lines are dotted with the specified pixel spacing between dots. Dense point sets are resampled to that spacing before rendering. Default is 0.
- legend(text: str, symbol=None, color=None)
Adds a legend
- Parameters:
text (str) – The text to be displayed in the legend.
symbol (symbols, optional) – The symbol to be used in the legend. If not provided, the symbol used to display the points will be used.
color (optional) – The color to be used for the legend text. If not provided, the default color will be used.
- Returns:
self – Returns the instance of the arrow object with the updated legend.
- Return type:
object
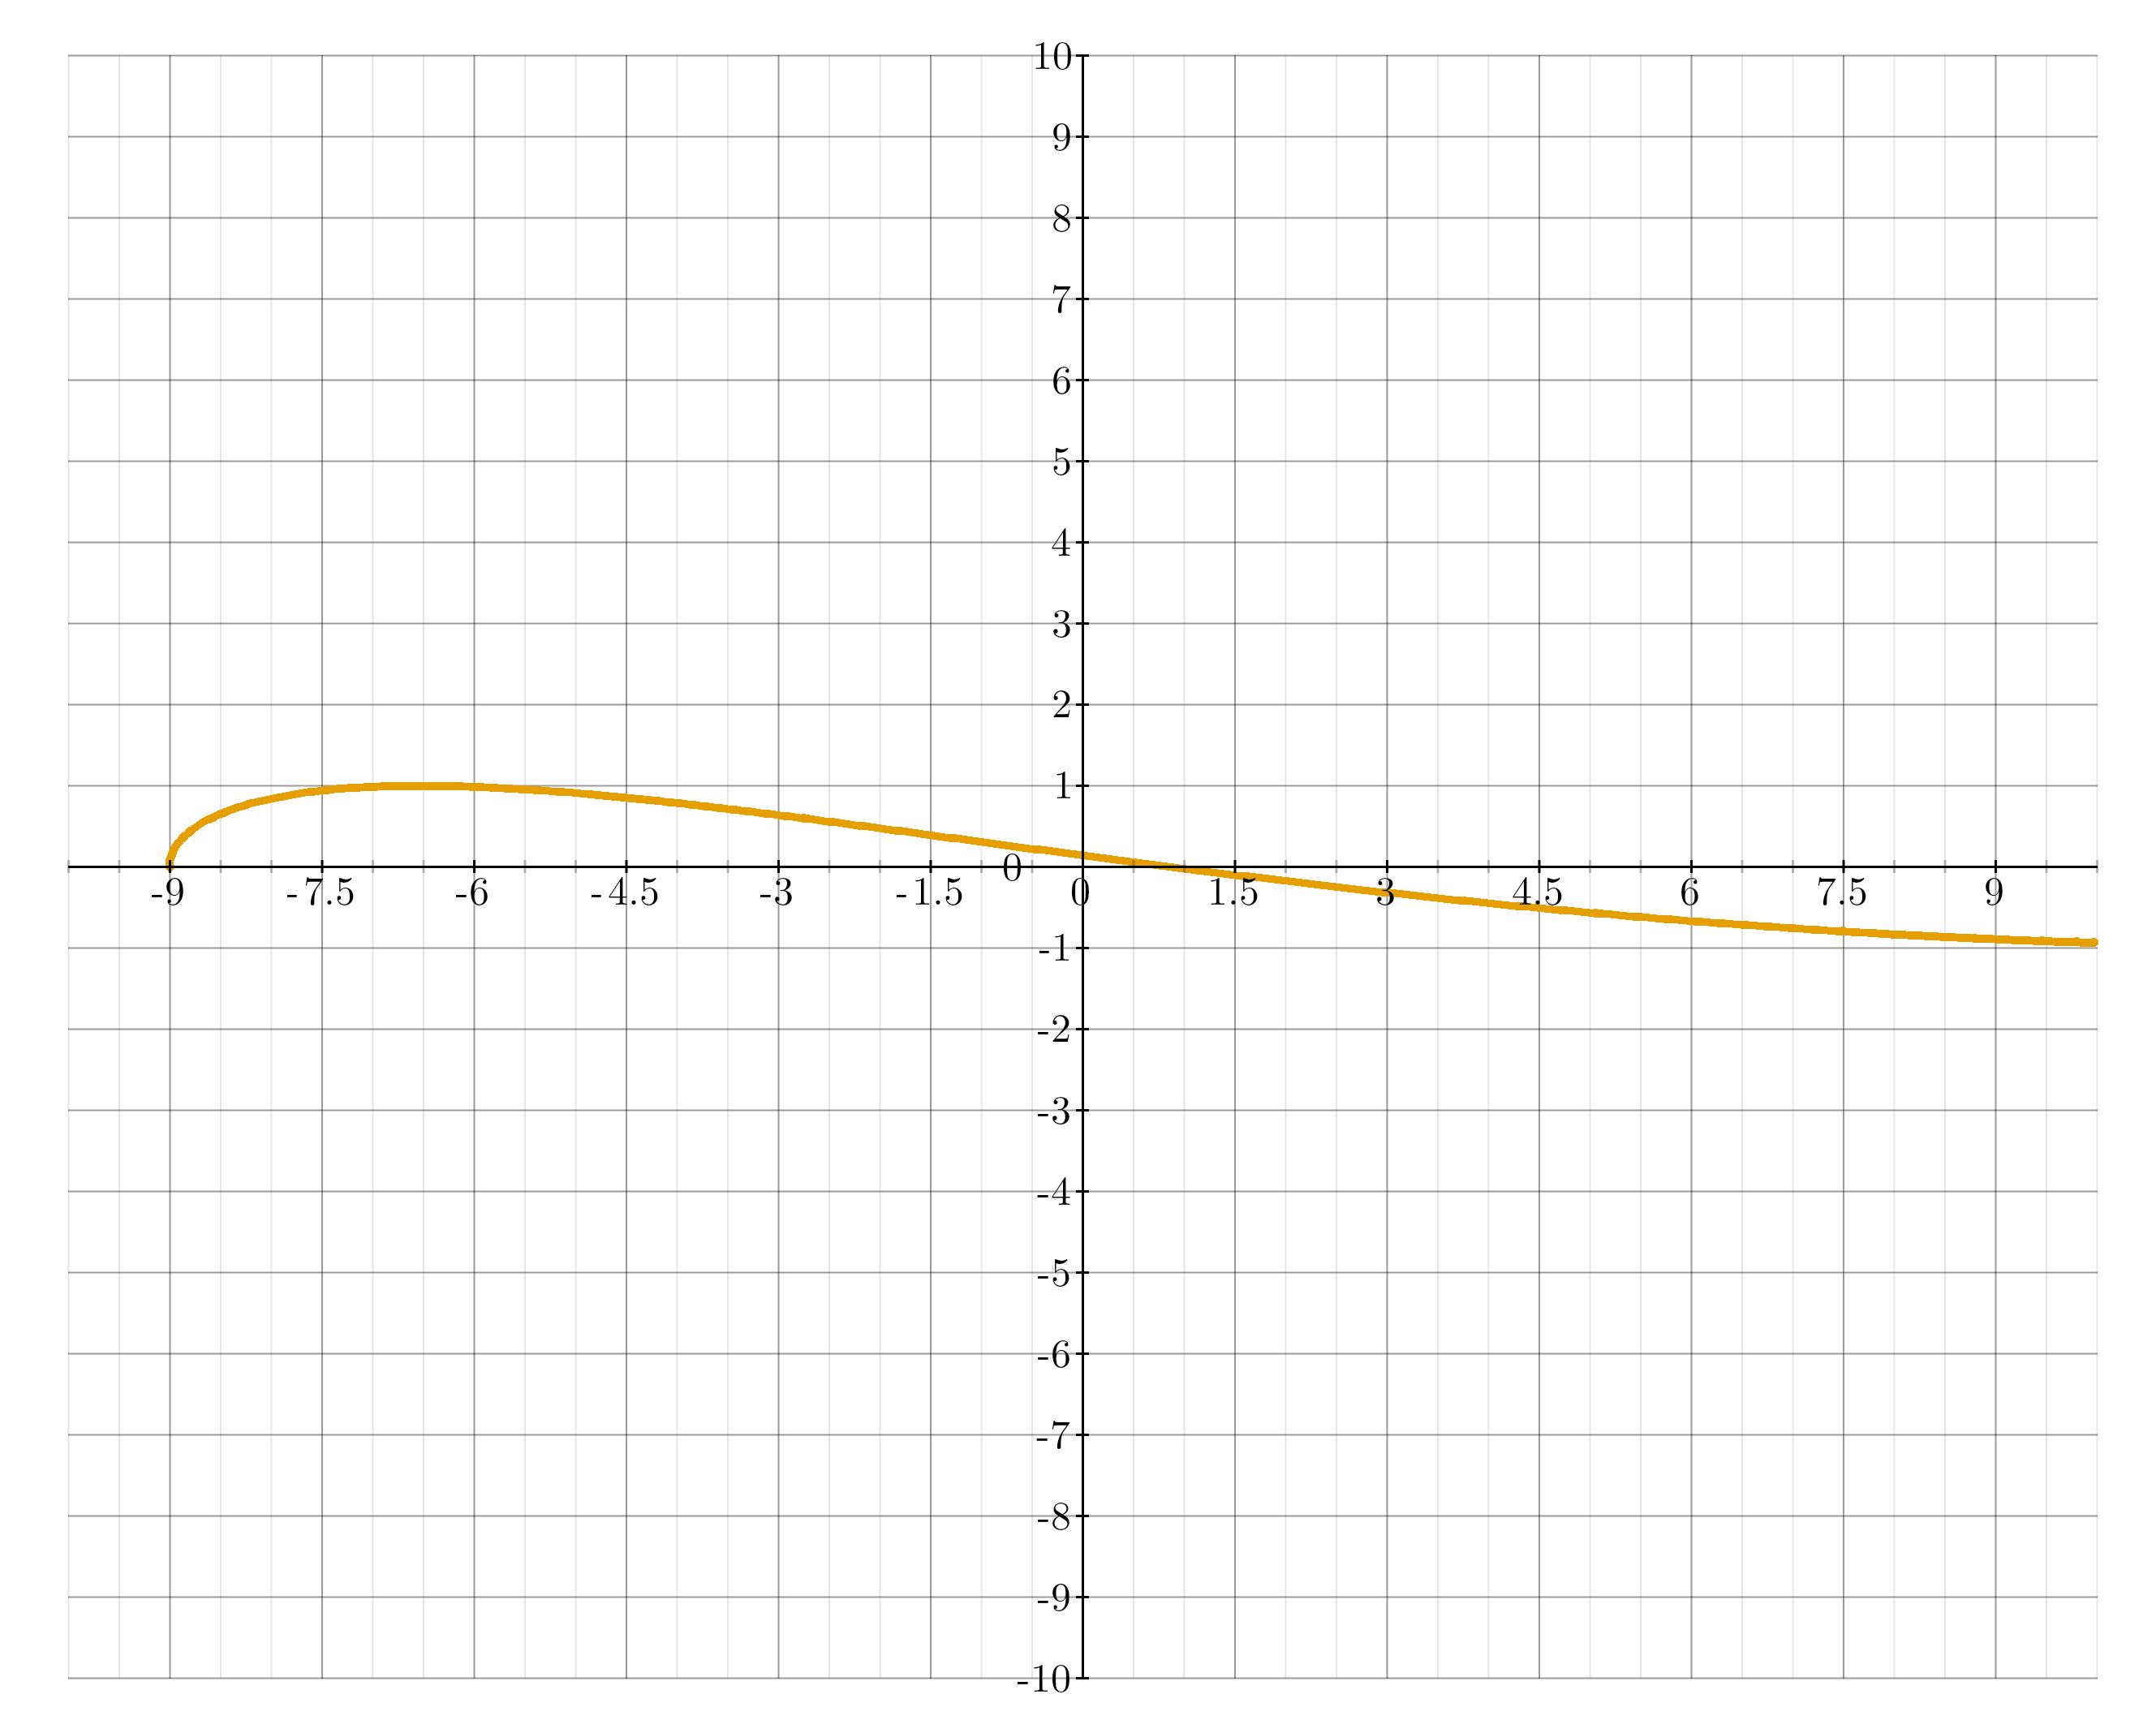
- class kaxe.Function2D(f: Callable, color: tuple = None, width: int = 10, dotted: int = 0, dashed: int = 0, domain: Sequence[float] | None = None, range: Sequence[float] | None = None, *args, **kwargs)
A class to represent a 2D function for plotting
Supports classical plots, polar plots and logarithmic plot
- Parameters:
f (callable) – The function to be plotted. It should take a single argument and return a value y. The function is not contained to a domain.
color (tuple, optional) – The color of the function plot. If not provided, a random color will be used.
width (int, optional) – The thickness of the function plot line. Default is 10.
dotted (int, optional) – If greater than 0, the function plot line will be dotted with the specified distance between dots. Default is 0.
dashed (int, optional) – If greater than 0, the function plot line will be dashed with the specified distance between dashes. Default is 0.
domain (tuple, optional) – Sampling interval
(x0, x1)for auto-scaled x when the plot window does not fix x. Default is(-10, 10).range (tuple, optional) – Fixed output interval
(y0, y1)for the y axis when auto-scaling.args (tuple, optional) – Additional positional arguments to be passed to the function f.
kwargs (dict, optional) – Additional keyword arguments to be passed to the function f.
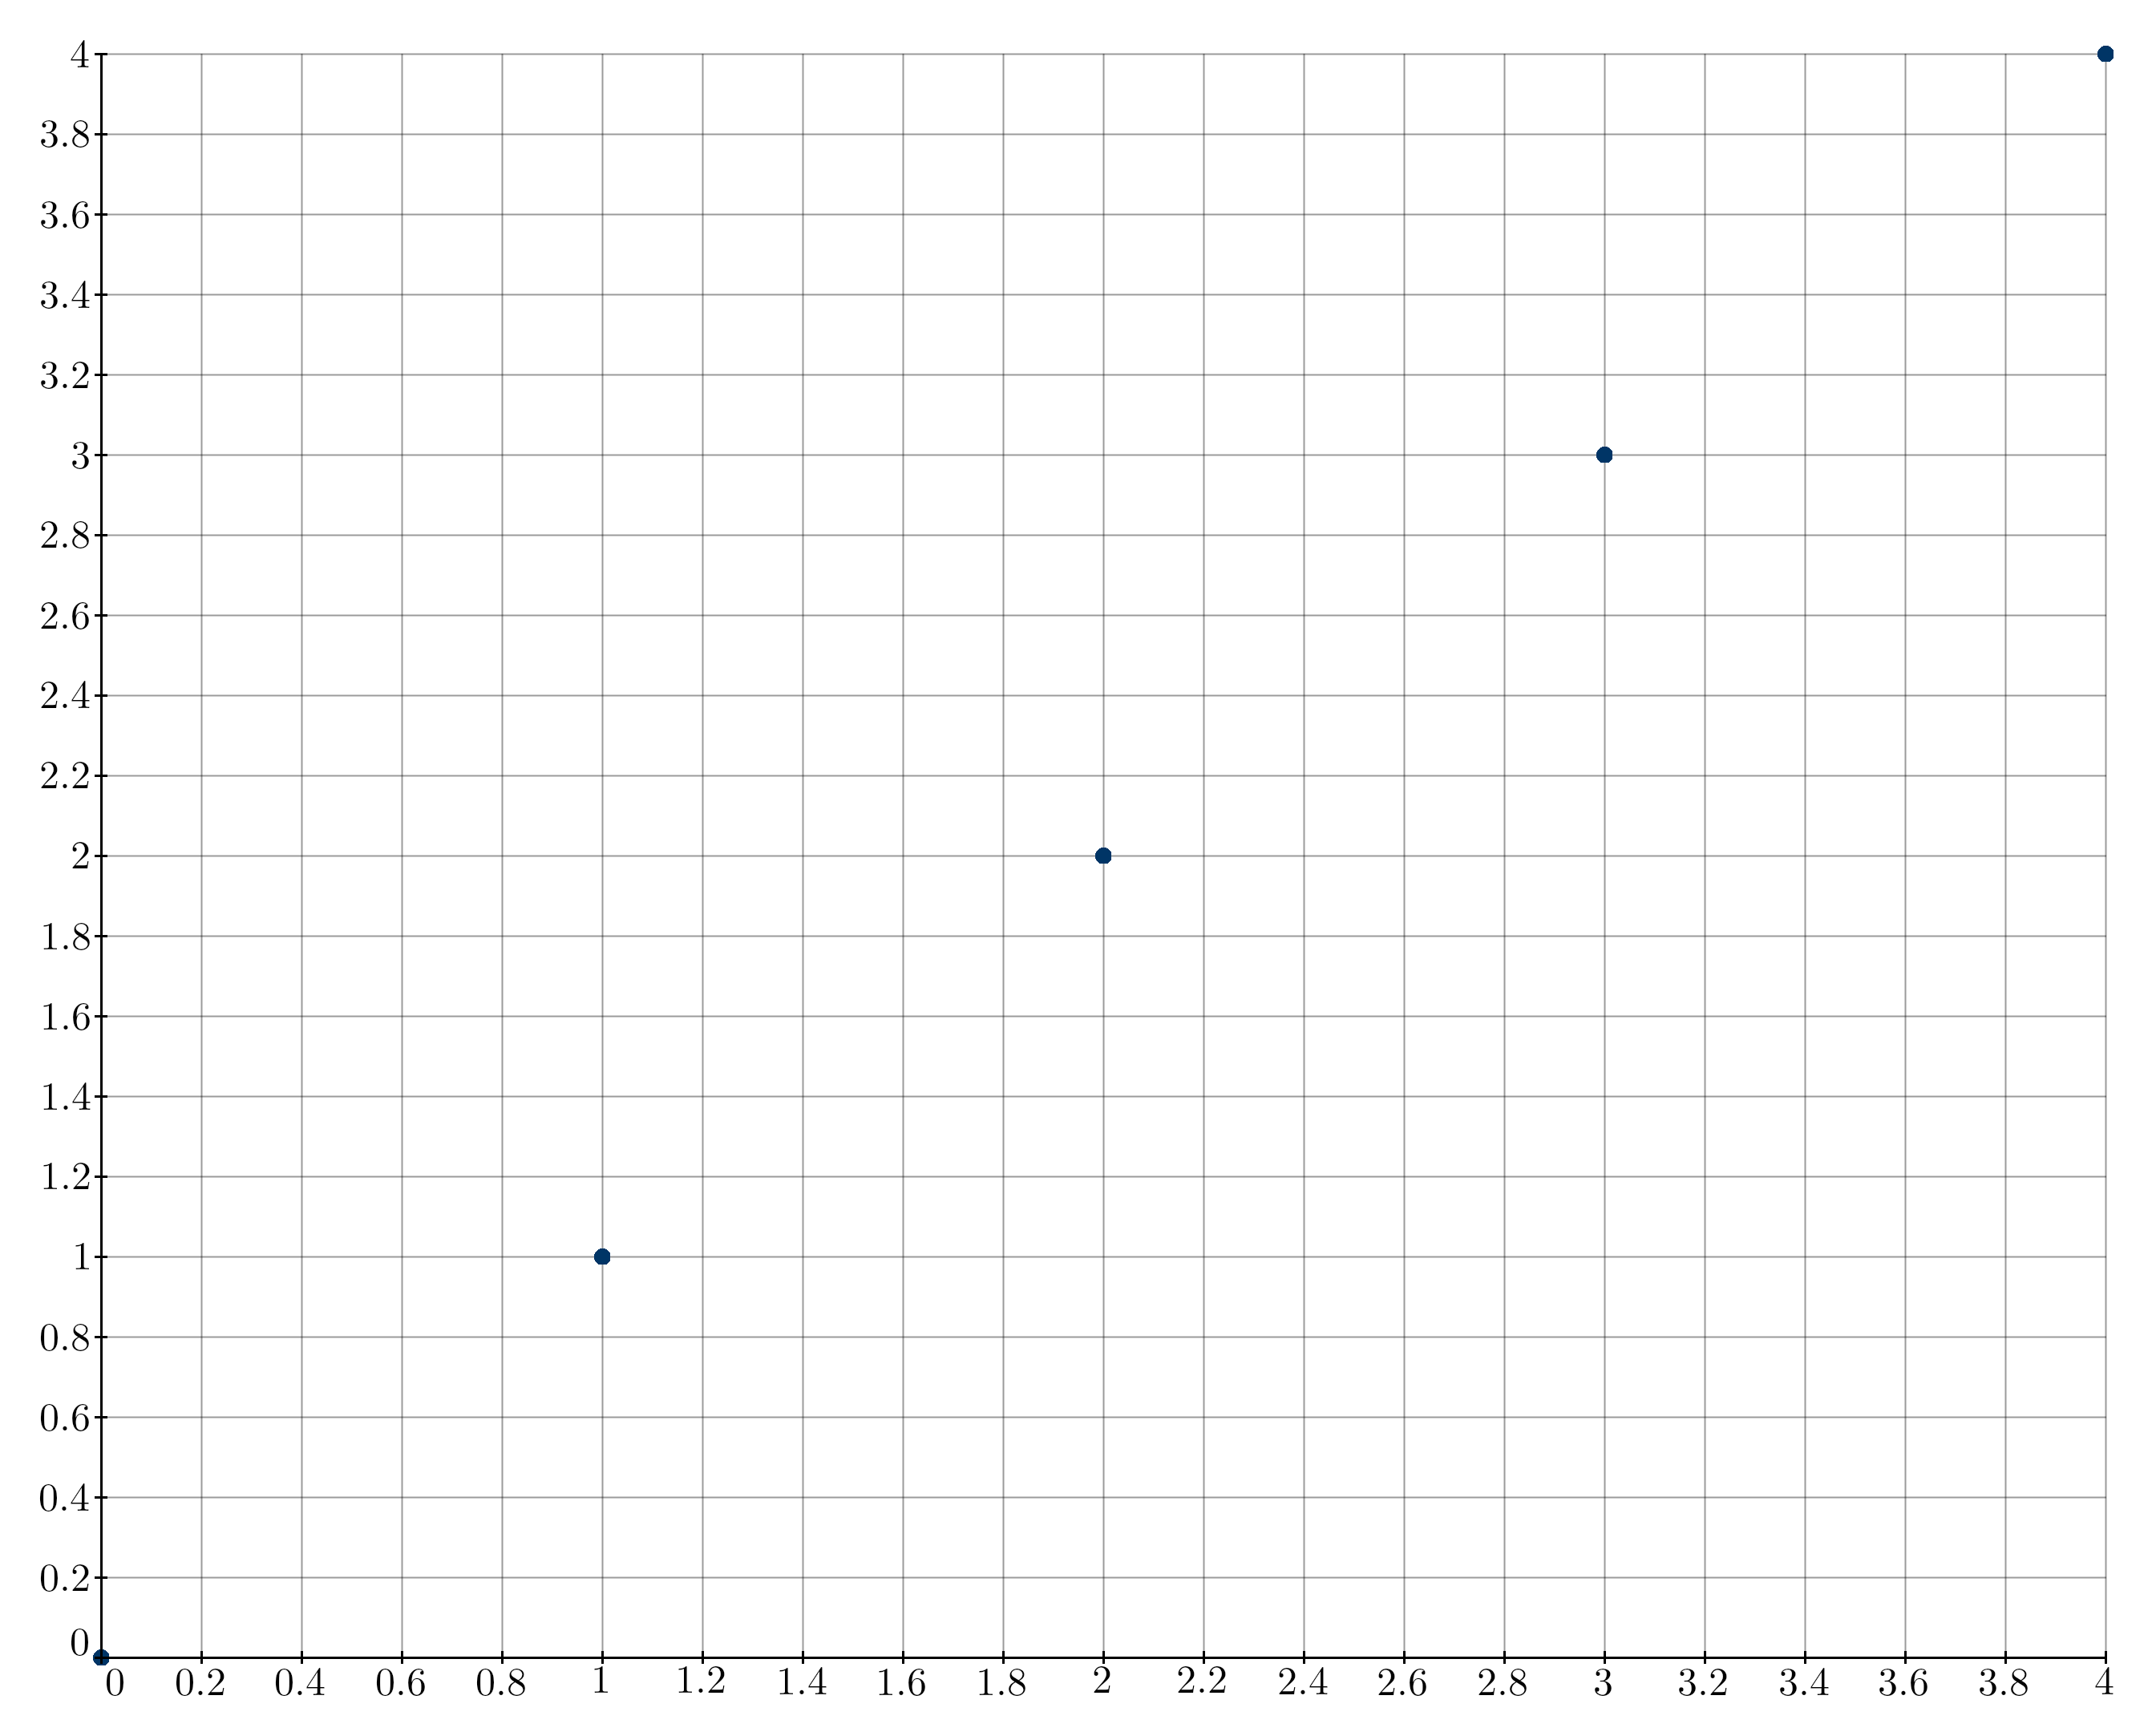
- __call__(x)
Evaluates the function at a given x value.
Examples
>>> def f(x):
...     return 2*x
>>> func = kaxe.Function2D(f(x))
>>> func(2)
4
>>> plt.add(func)
When the plot window leaves an axis as
None,kaxe.Function2Destimates bounds by coarse sampling. Usedomainto control the x sampling interval andrangeto pin the y axis. See API Workflow for auto-scaling details.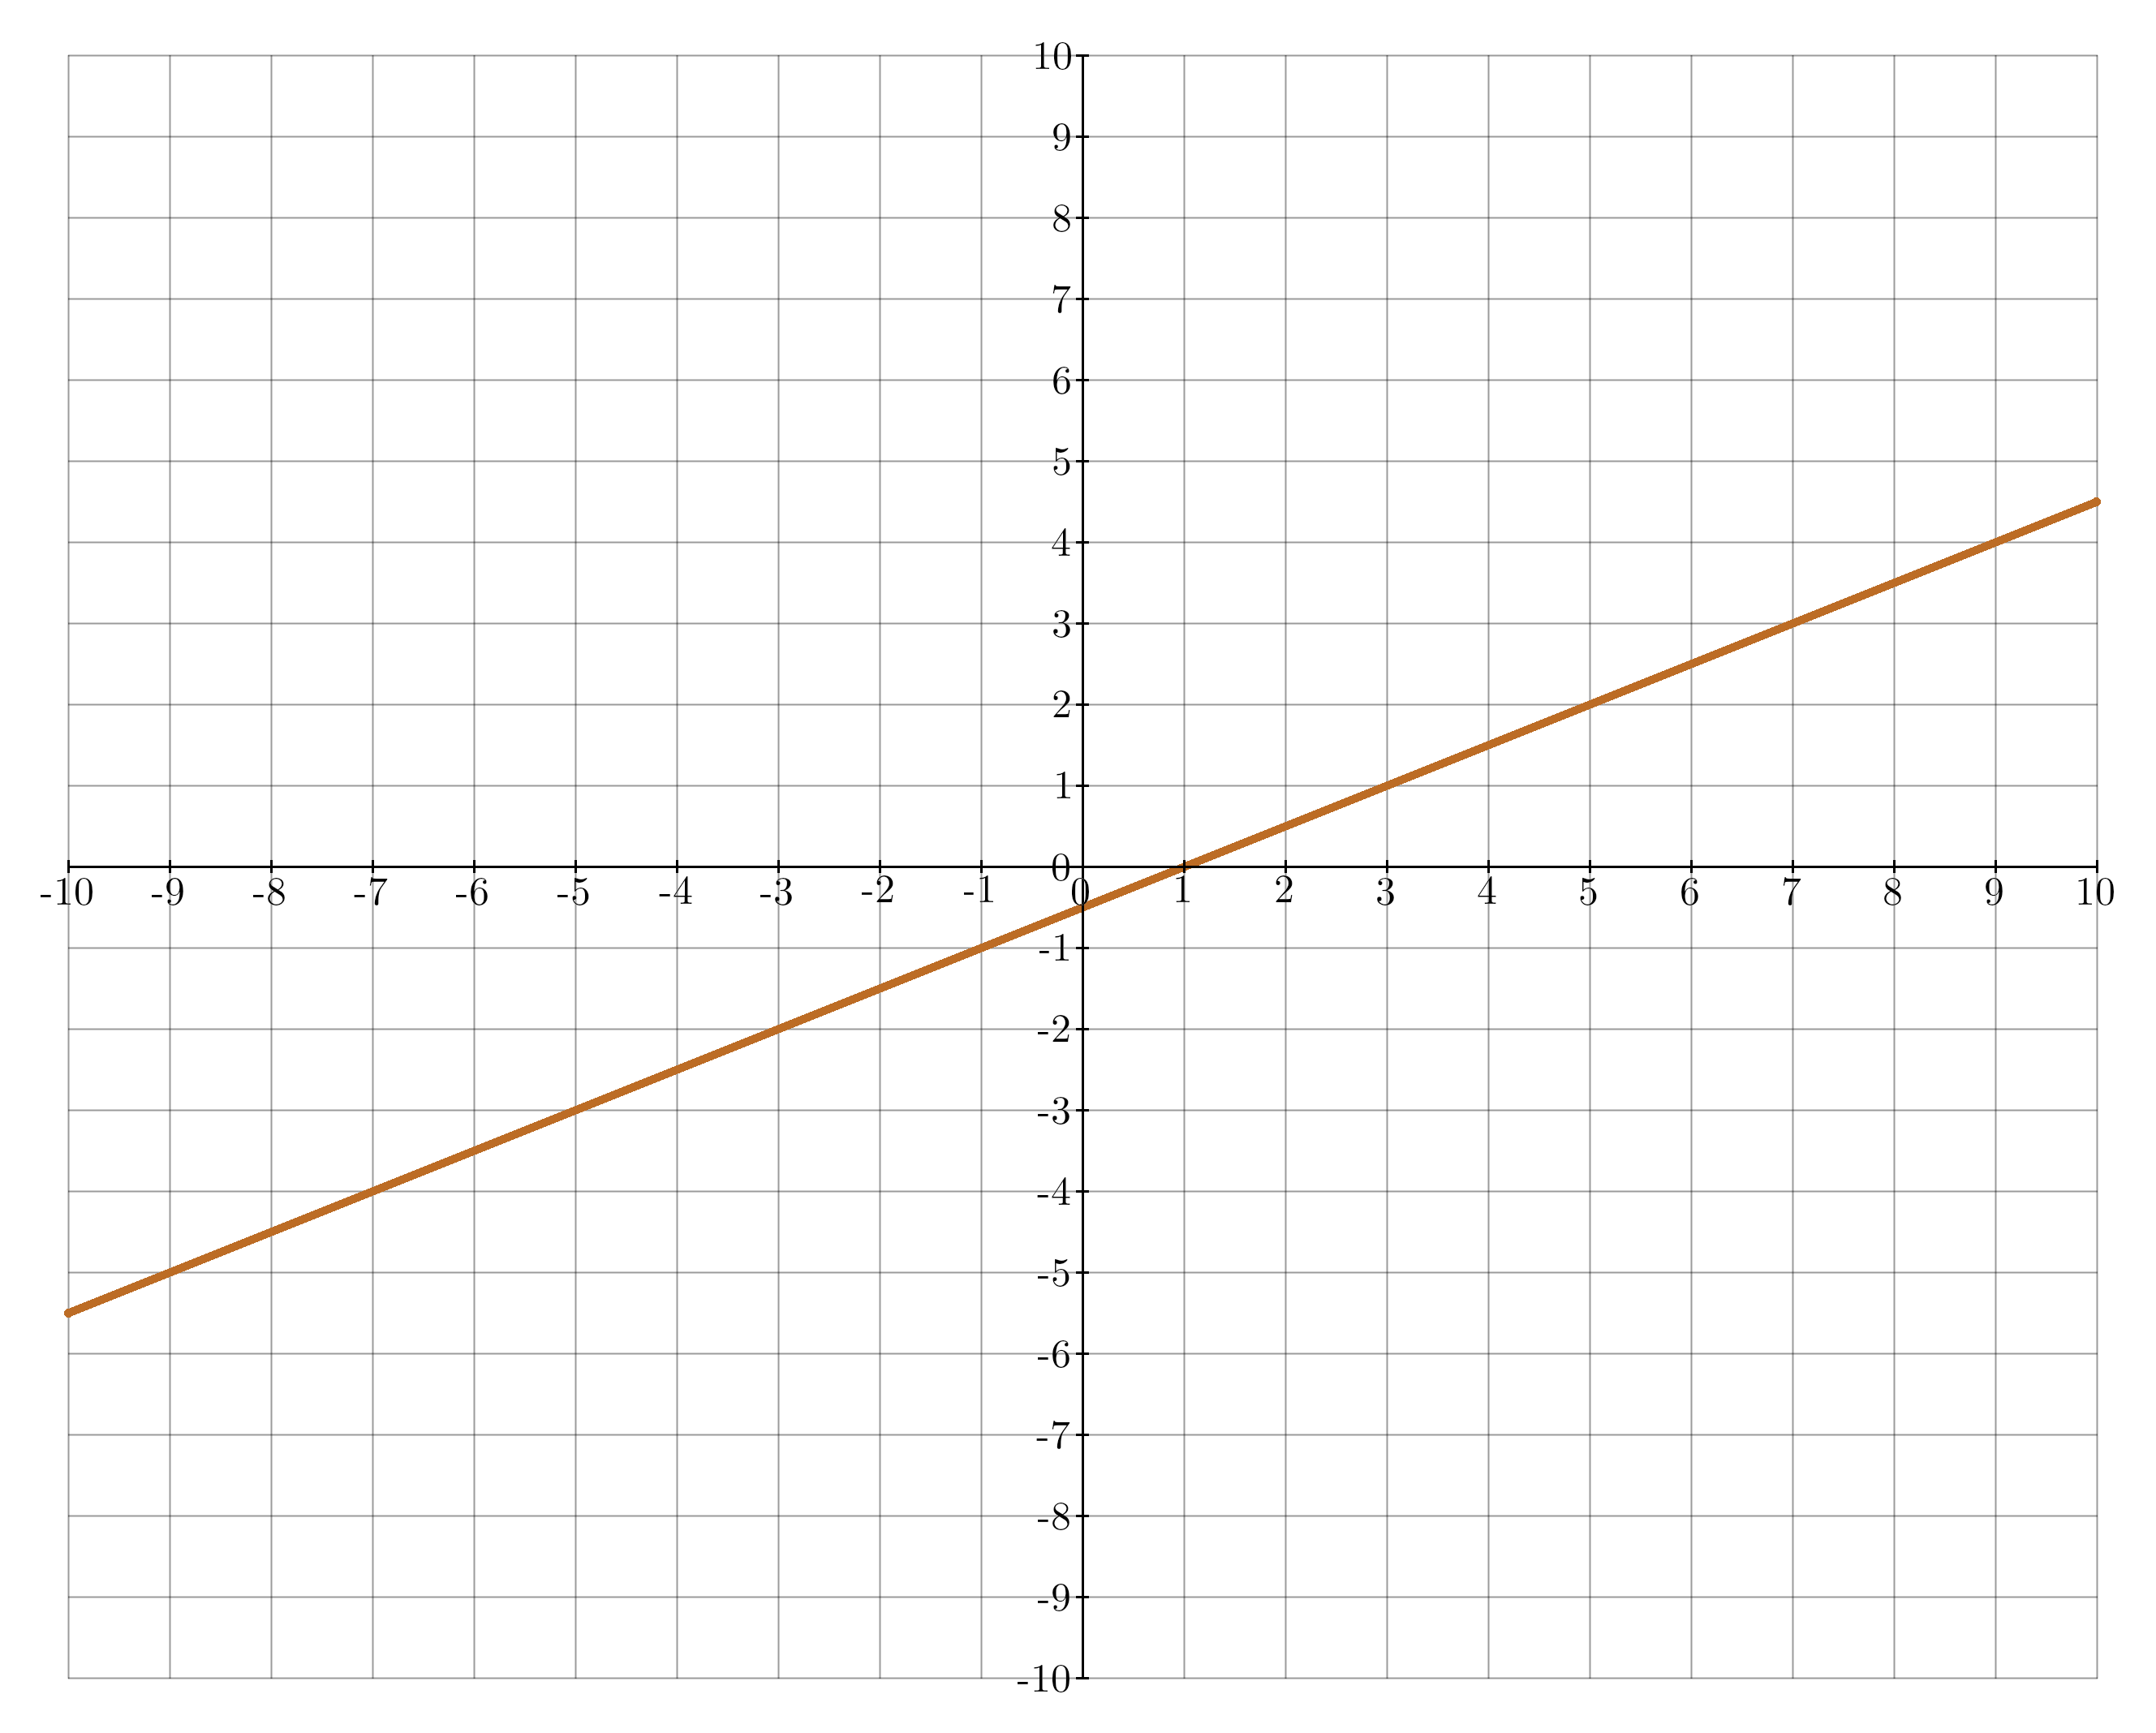
- bounds(plot_window=None, plot=None)
Estimate data bounds for auto-scaling.
Returns up to six values
[x0, x1, y0, y1, z0, z1]. Entries areNonewhen that axis is fixed by the plot window or not applicable.
- fill(x0, x1)
Fills the area in the graph between x0 and x1
- Parameters:
x0 (int|float) – Left first axis value to start the fill
x1 (int|float) – Right first axis value to end the fill
- legend(text: str, symbol=None, color=None)
Adds a legend
- Parameters:
text (str) – The text to be displayed in the legend.
symbol (symbols, optional) – The symbol to be used in the legend.
color (optional) – The color to be used for the legend text. If not provided, the default color will be used.
- Returns:
self – Returns the instance of the arrow object with the updated legend.
- Return type:
object
- tangent(x, dx=1e-05)
Creates an tangent using central diffrence quotient
- Parameters:
x (int|float) – x-value where tangent will be placed
dx (int|float, optional) – Step size for CFDM
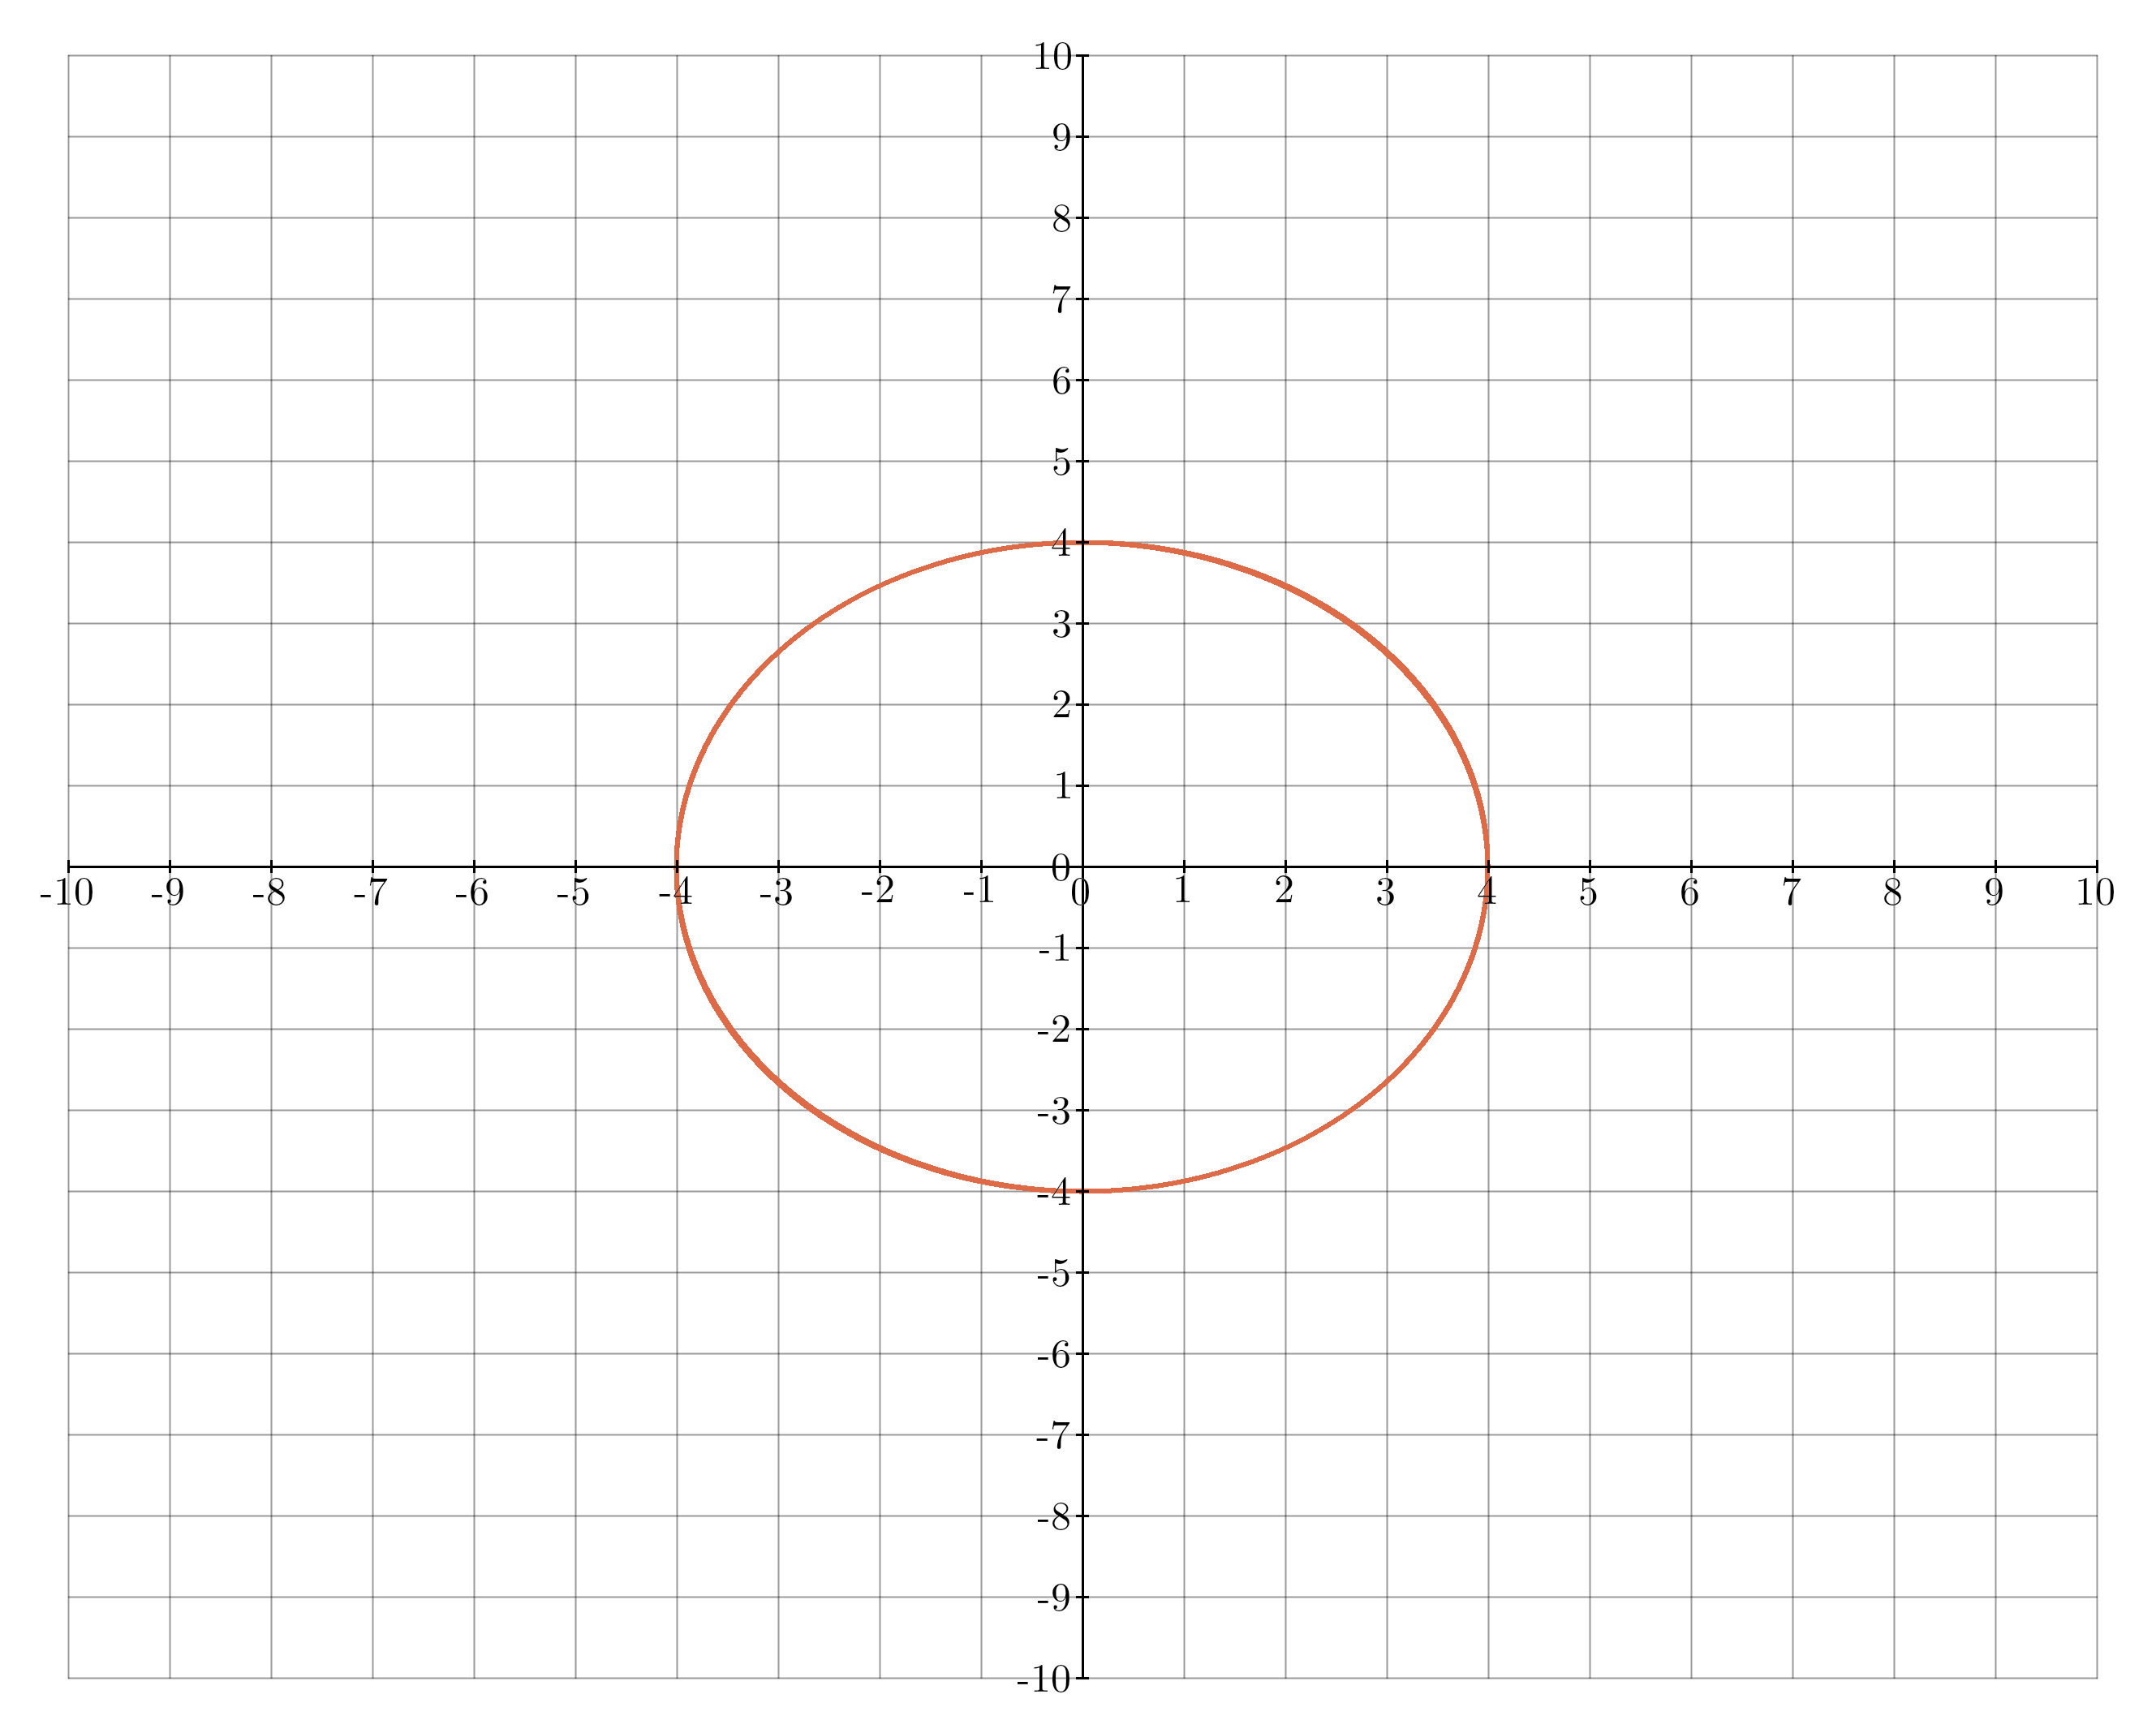
- class kaxe.Equation(left, right, color: tuple = None, width: int = 2, computePadding=50)
A class to represent a mathematical equation from left and right side of equation.
Supported in classical plots, polar plot and 3D plots as a 2D object with z=0
- Parameters:
left (callable) – Left side of the equation
right (callable) – Right side of the equation
color (tuple|list, optional) – Color to display the equation , if default is None a random color will be assigned
width (int) – Line thickness, default is 2
Examples
>>> def left(x, y):
...     return x**2 + y**2
>>> def right(x, y):
...     return 1
>>> eq = Equation(left, right)
>>> eq.legend("Circle", color=(255, 0, 0, 255))
>>> plt.add(eq)
- legend(text: str, symbol='LINE', color=None)
Adds a legend
- Parameters:
text (str) – The text to be displayed in the legend.
symbol (symbols, optional) – The symbol to be used in the legend.
color (optional) – The color to be used for the legend text. If not provided, the default color will be used.
computePadding (int, optional) – When generating the equation some padding can be needed to include the edges properly (default is 50).
- Returns:
self – Returns the instance of the arrow object with the updated legend.
- Return type:
object
- class kaxe.Inequality(left, right, op='<=', color=None, width=2, hatch_color=(255, 0, 0, 180), hatch_spacing=10, hatch_width=1, hatch_angle=45, hatch_band=None, computePadding=50)
A class to represent a two-variable inequality
left op right.Draws the boundary curve (same as
Equation) and red diagonal hatching on the forbidden side of the inequality.Supported in classical plots, polar plot and 3D plots as a 2D object with
z=0.- Parameters:
left (callable or real) – Left side of the inequality. A real number is treated as constant in
xandy.right (callable or real) – Right side of the inequality. A real number is treated as constant in
xandy.op (str, optional) – Comparison operator:
<=,<,>=, or>(default is<=).color (tuple | list, optional) – Boundary line color. Random if omitted.
width (int, optional) – Boundary line thickness (default is 2).
hatch_color (tuple | list, optional) – Color of forbidden-region hatching (default is red with transparency).
hatch_spacing (int, optional) – Pixel spacing between parallel hatch lines (default is 10).
hatch_width (int, optional) – Hatch line thickness (default is 1).
hatch_angle (float, optional) – Hatch line angle in degrees, measured counter-clockwise from the horizontal axis (default is 45).
hatch_band (float, optional) – Maximum pixel distance from the boundary to draw hatching. When omitted, the entire forbidden side is hatched.
computePadding (int, optional) – Extra padding when sampling the plot area (default is 50).
Examples
>>> g = lambda x, y: x + y - 3
>>> ineq = Inequality(g, 0)
>>> plt.add(ineq)
Hatching marks the forbidden side of the inequality (where the comparison is not satisfied).
- legend(text: str, symbol='LINE', color=None)
Adds a legend entry for this inequality.
- Parameters:
text (str) – The text to display in the legend.
symbol (symbols, optional) – The symbol to use in the legend.
color (optional) – Legend color. Uses the boundary color if omitted.
- Return type:
self
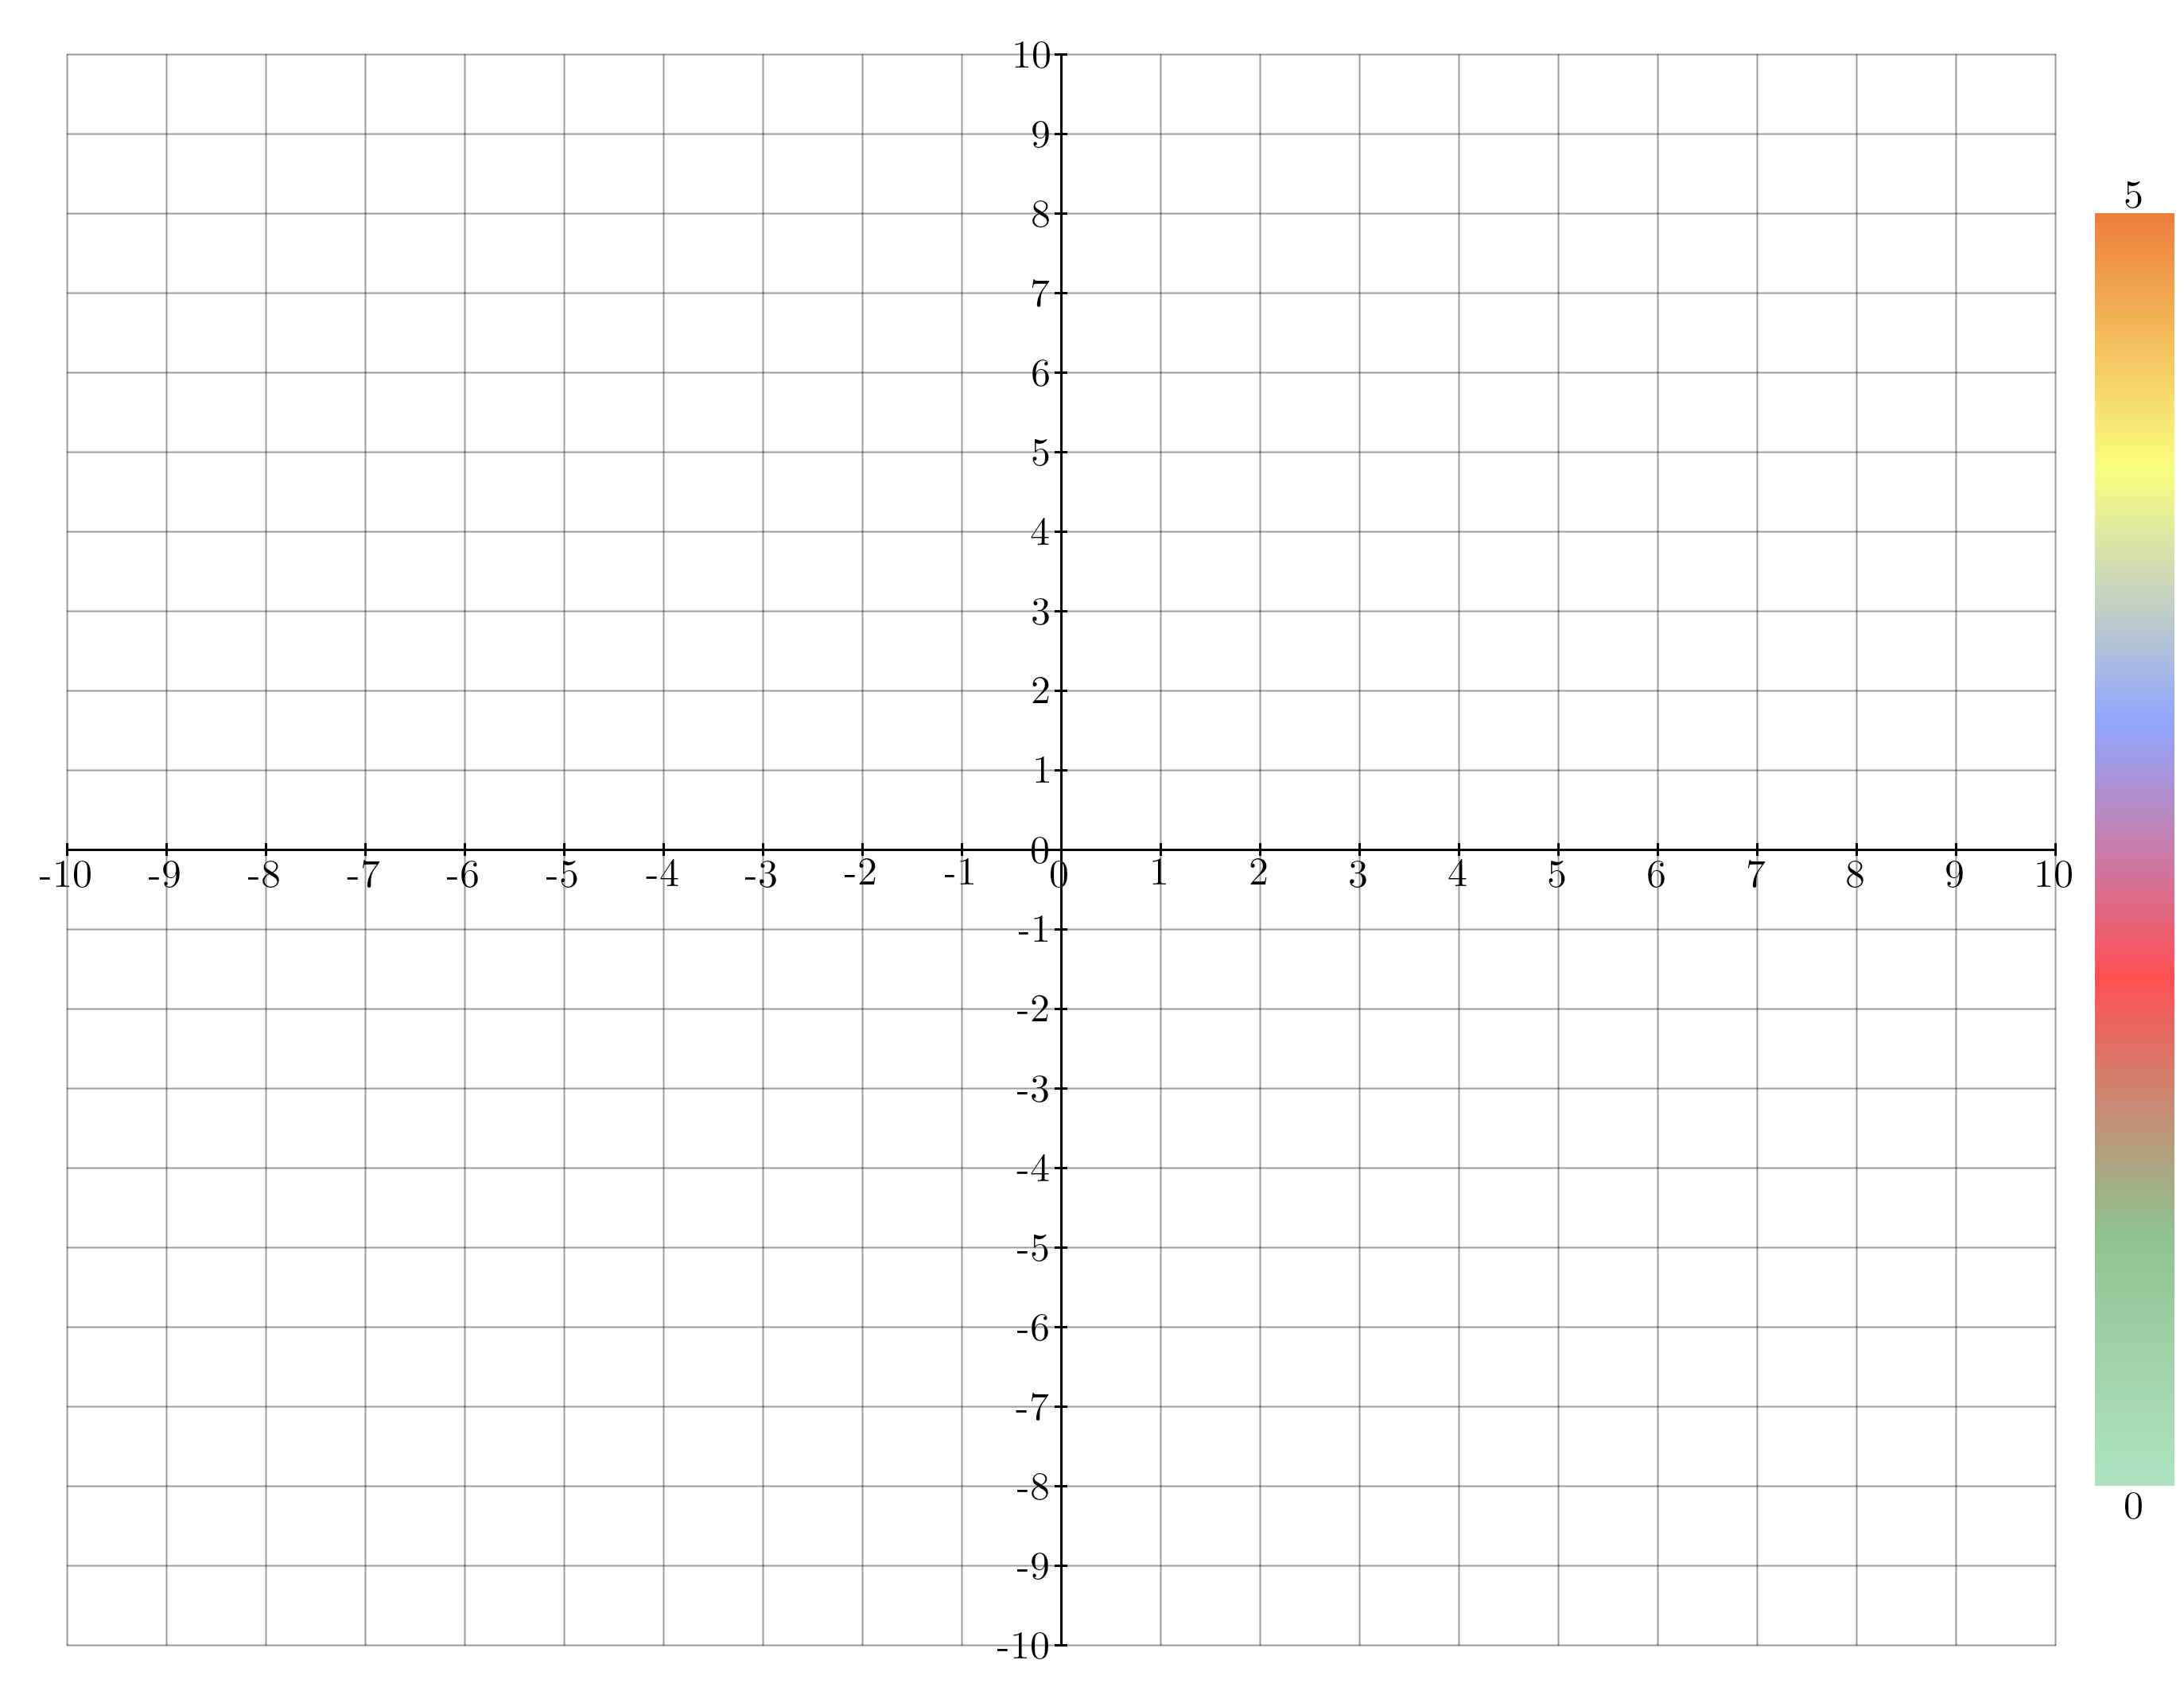
- class kaxe.ColorScale(lower: float | int | tuple, upper: float | int | tuple, cmap=<kaxe.core.color.Colormap object>, width: int | None = None, title: str | None = None)
ColorScale to be added in the right middle of the window
Supports all plots
- Parameters:
lower (Union[float, int, tuple]) – The lower bound of the color scale. Can be a number or a tuple of length 2 with value and title as values.
upper (Union[float, int, tuple]) – The upper bound of the color scale. Can be a number or a tuple of length 2 with value and title as values.
cmap (Colormaps, optional) – The colormap to use for the color scale. Default is Colormaps.standard.
width (Union[int, None], optional) – The width of the color scale. Default is None.
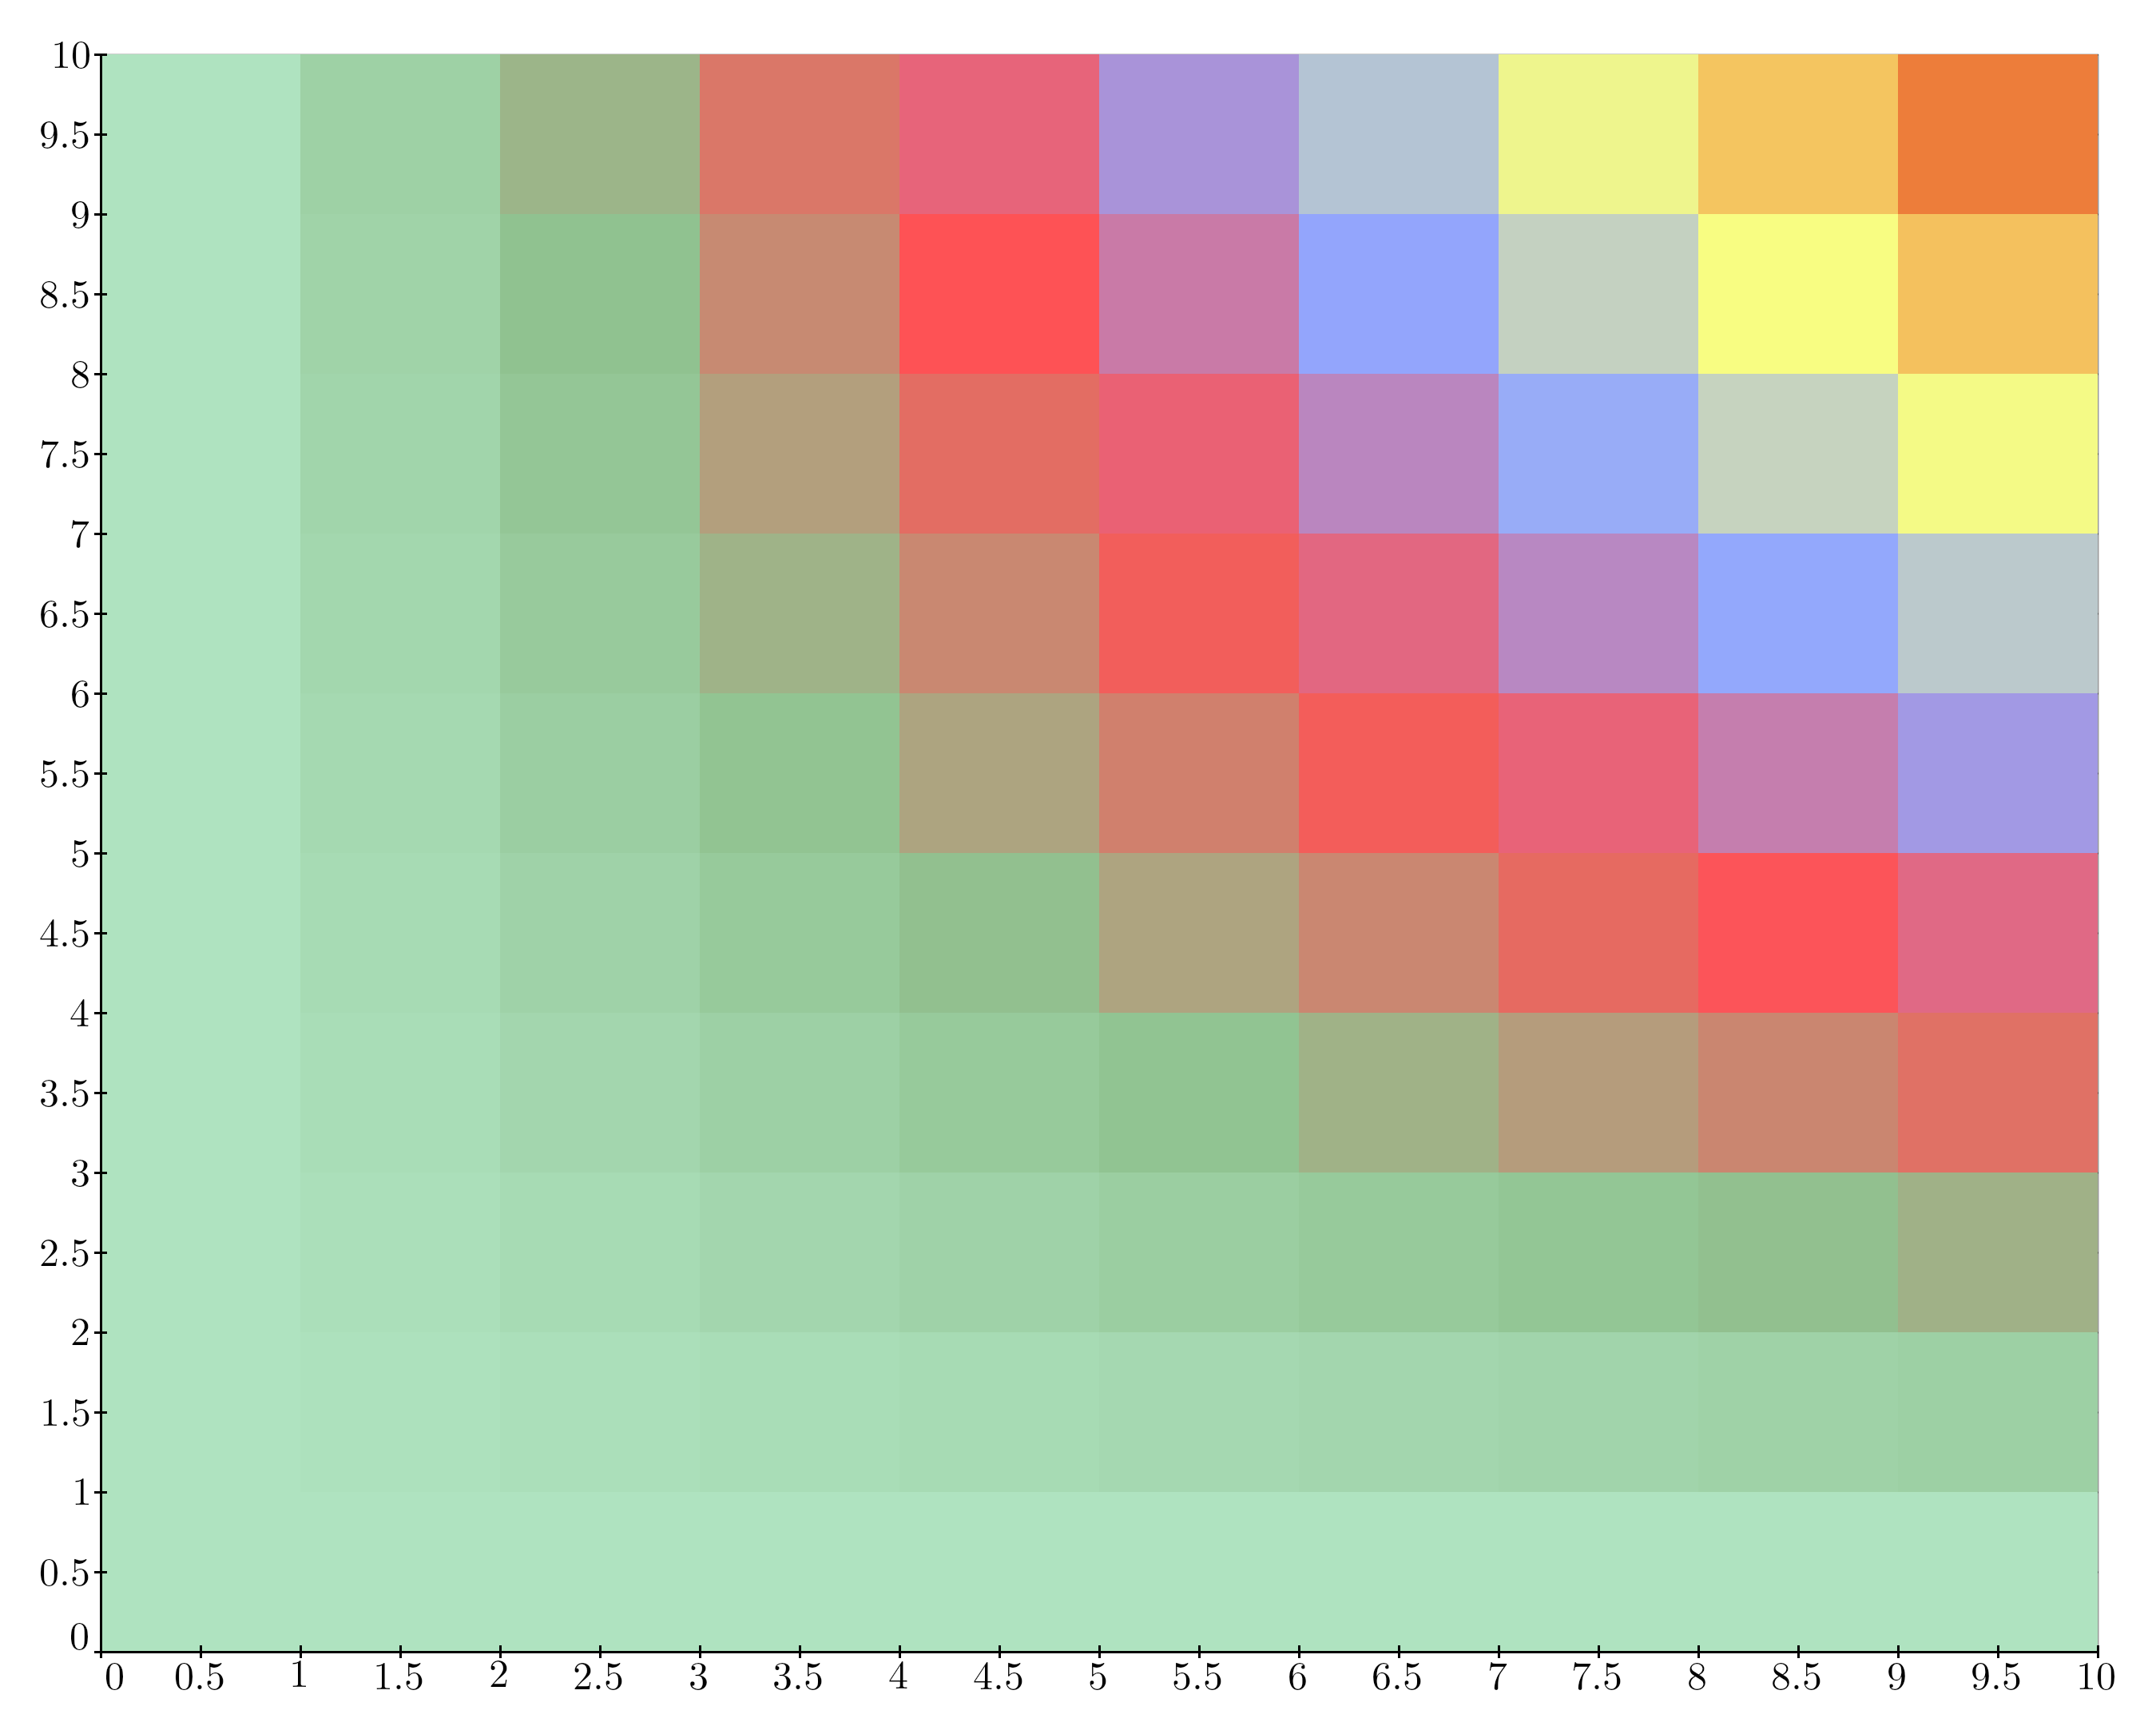
- class kaxe.HeatMap(data, cmap=<kaxe.core.color.Colormap object>, unitPerPixel: list[float] = [1, 1], position: list | tuple = (0, 0), minValue=None, maxValue=None)
A class to represent a heatmap visualization.
- Parameters:
data (list of list of float or int) – A 2D list containing the data values for the heatmap.
cmap (Colormap, optional) – A colormap instance to map data values to colors (default is Colormaps.standard).
unitPerPixel (list of float, optional) – A list containing the width and height of each pixel in the heatmap in terms of the unit space (default is [1, 1]).
position (list or tuple, optional) – The (x, y) position of the bottom-left corner of the heatmap in the unit space (default is (0, 0)).
minValue (float or int, optional) – The minimum value for the heatmap. If not provided, it is calculated from the data.
maxValue (float or int, optional) – The maximum value for the heatmap. If not provided, it is calculated from the data.
- addColorScale(parent, digits=64)
Adds a color scale to the specified parent object.
This method creates a ColorScale object using the instance’s minimum and maximum values (self.minValue and self.maxValue) and colormap (self.cmap), then adds it to the provided parent object.
- Parameters:
parent (object) – The object to which the color scale will be added. It must have an add method that accepts a ColorScale object.
digits (int) – Number of digits to display
- Returns:
The instance of the class, allowing for method chaining.
- Return type:
- classmethod fromFunction(f: Callable, numSamples: int = 100, domain=None, cmap=<kaxe.core.color.Colormap object>, minValue=None, maxValue=None, *args, **kwargs)
Build a heatmap by sampling a 2D function on a regular grid.
- Parameters:
f (callable) – Function
f(x, y)returning the value at each grid point. May accept numpy arrays for vectorized evaluation.numSamples (int, optional) – Number of cells per axis (default is 100).
domain (tuple, optional) – Placement region
(x0, x1, y0, y1)in plot coordinates (default is(-10, 10, -10, 10)).cmap (Colormap, optional) – Colormap for value-to-color mapping.
minValue (float or int, optional) – Minimum value for the color scale. Calculated from data if omitted.
maxValue (float or int, optional) – Maximum value for the color scale. Calculated from data if omitted.
*args – Additional positional arguments passed to
f.**kwargs – Additional keyword arguments passed to
f.
- Return type:
Examples
>>> import math
>>> hm = kaxe.HeatMap.fromFunction(
...     lambda x, y: math.sin(x) * math.cos(y),
...     numSamples=100,
...     domain=(-10, 10, -10, 10),
... )
>>> plt.add(hm)
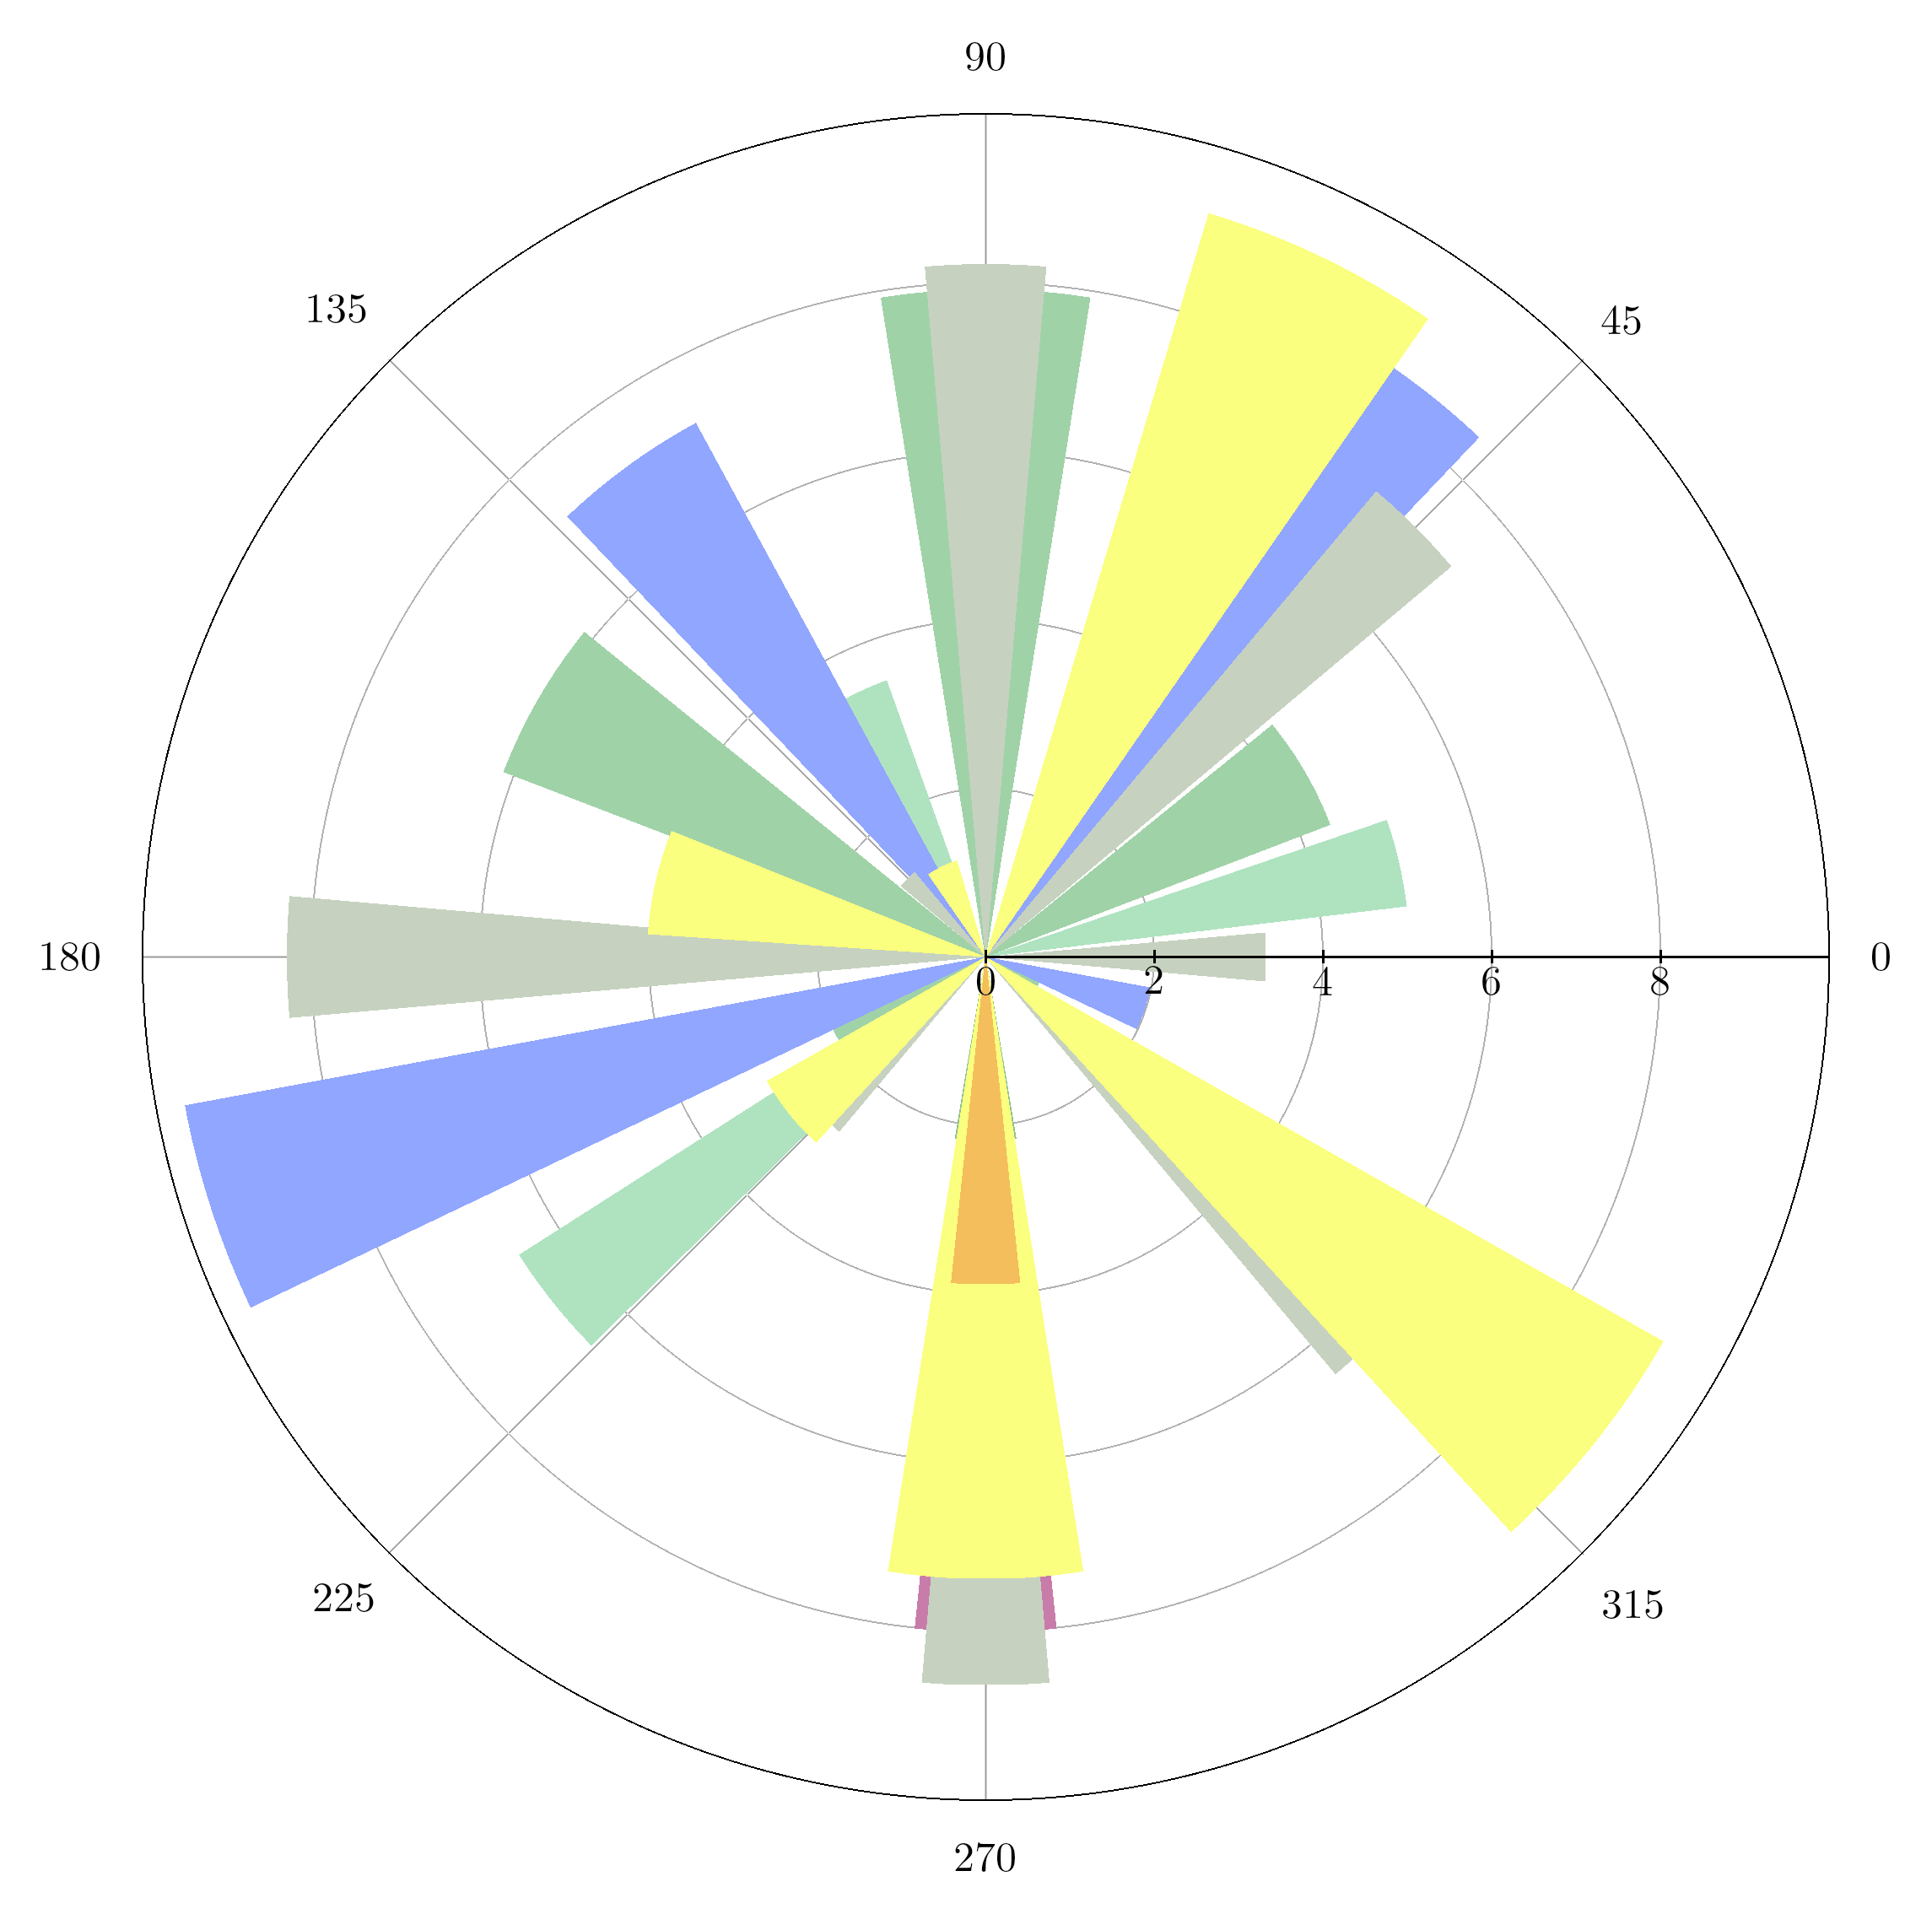
- class kaxe.Pillars(x, heights, colors: tuple | list[tuple] = None, width: int = None, outlineWidth=5, outlineColor: tuple = (0, 0, 0, 255))
Different pillars in plots
This is different from the Bar charts and Group Bar charts. This Object can be inserted into classical plots.
- Parameters:
x (list or array-like) – The x-coordinates of the center of the pillar.
heights (list or array-like) – The heights of the pillar at each x-coordinate. If this list contains multiple lists inside, each pillar will consist of multiple colors; This feature is not supported in polar plot.
color (tuple, optional) – The RGB color of the pillar. If None, a random color is assigned. Default is None.
width (int, optional) – The width of the pillar. Default is None.
outlineWidth (int, optional) – The width of the outline around the pillar. Default is 5.
outlineColor (tuple, optional) – The RGBA color of the outline around the pillar. Default is (0, 0, 0, 255).
- legend(text: str, symbol='RECT', color=None)
Adds a legend
- Parameters:
text (str) – The text to be displayed in the legend.
symbol (symbols, optional) – The symbol to be used in the legend.
color (optional) – The color to be used for the legend text. If not provided, the default color will be used.
- Returns:
self – Returns the instance of the arrow object with the updated legend.
- Return type:
object
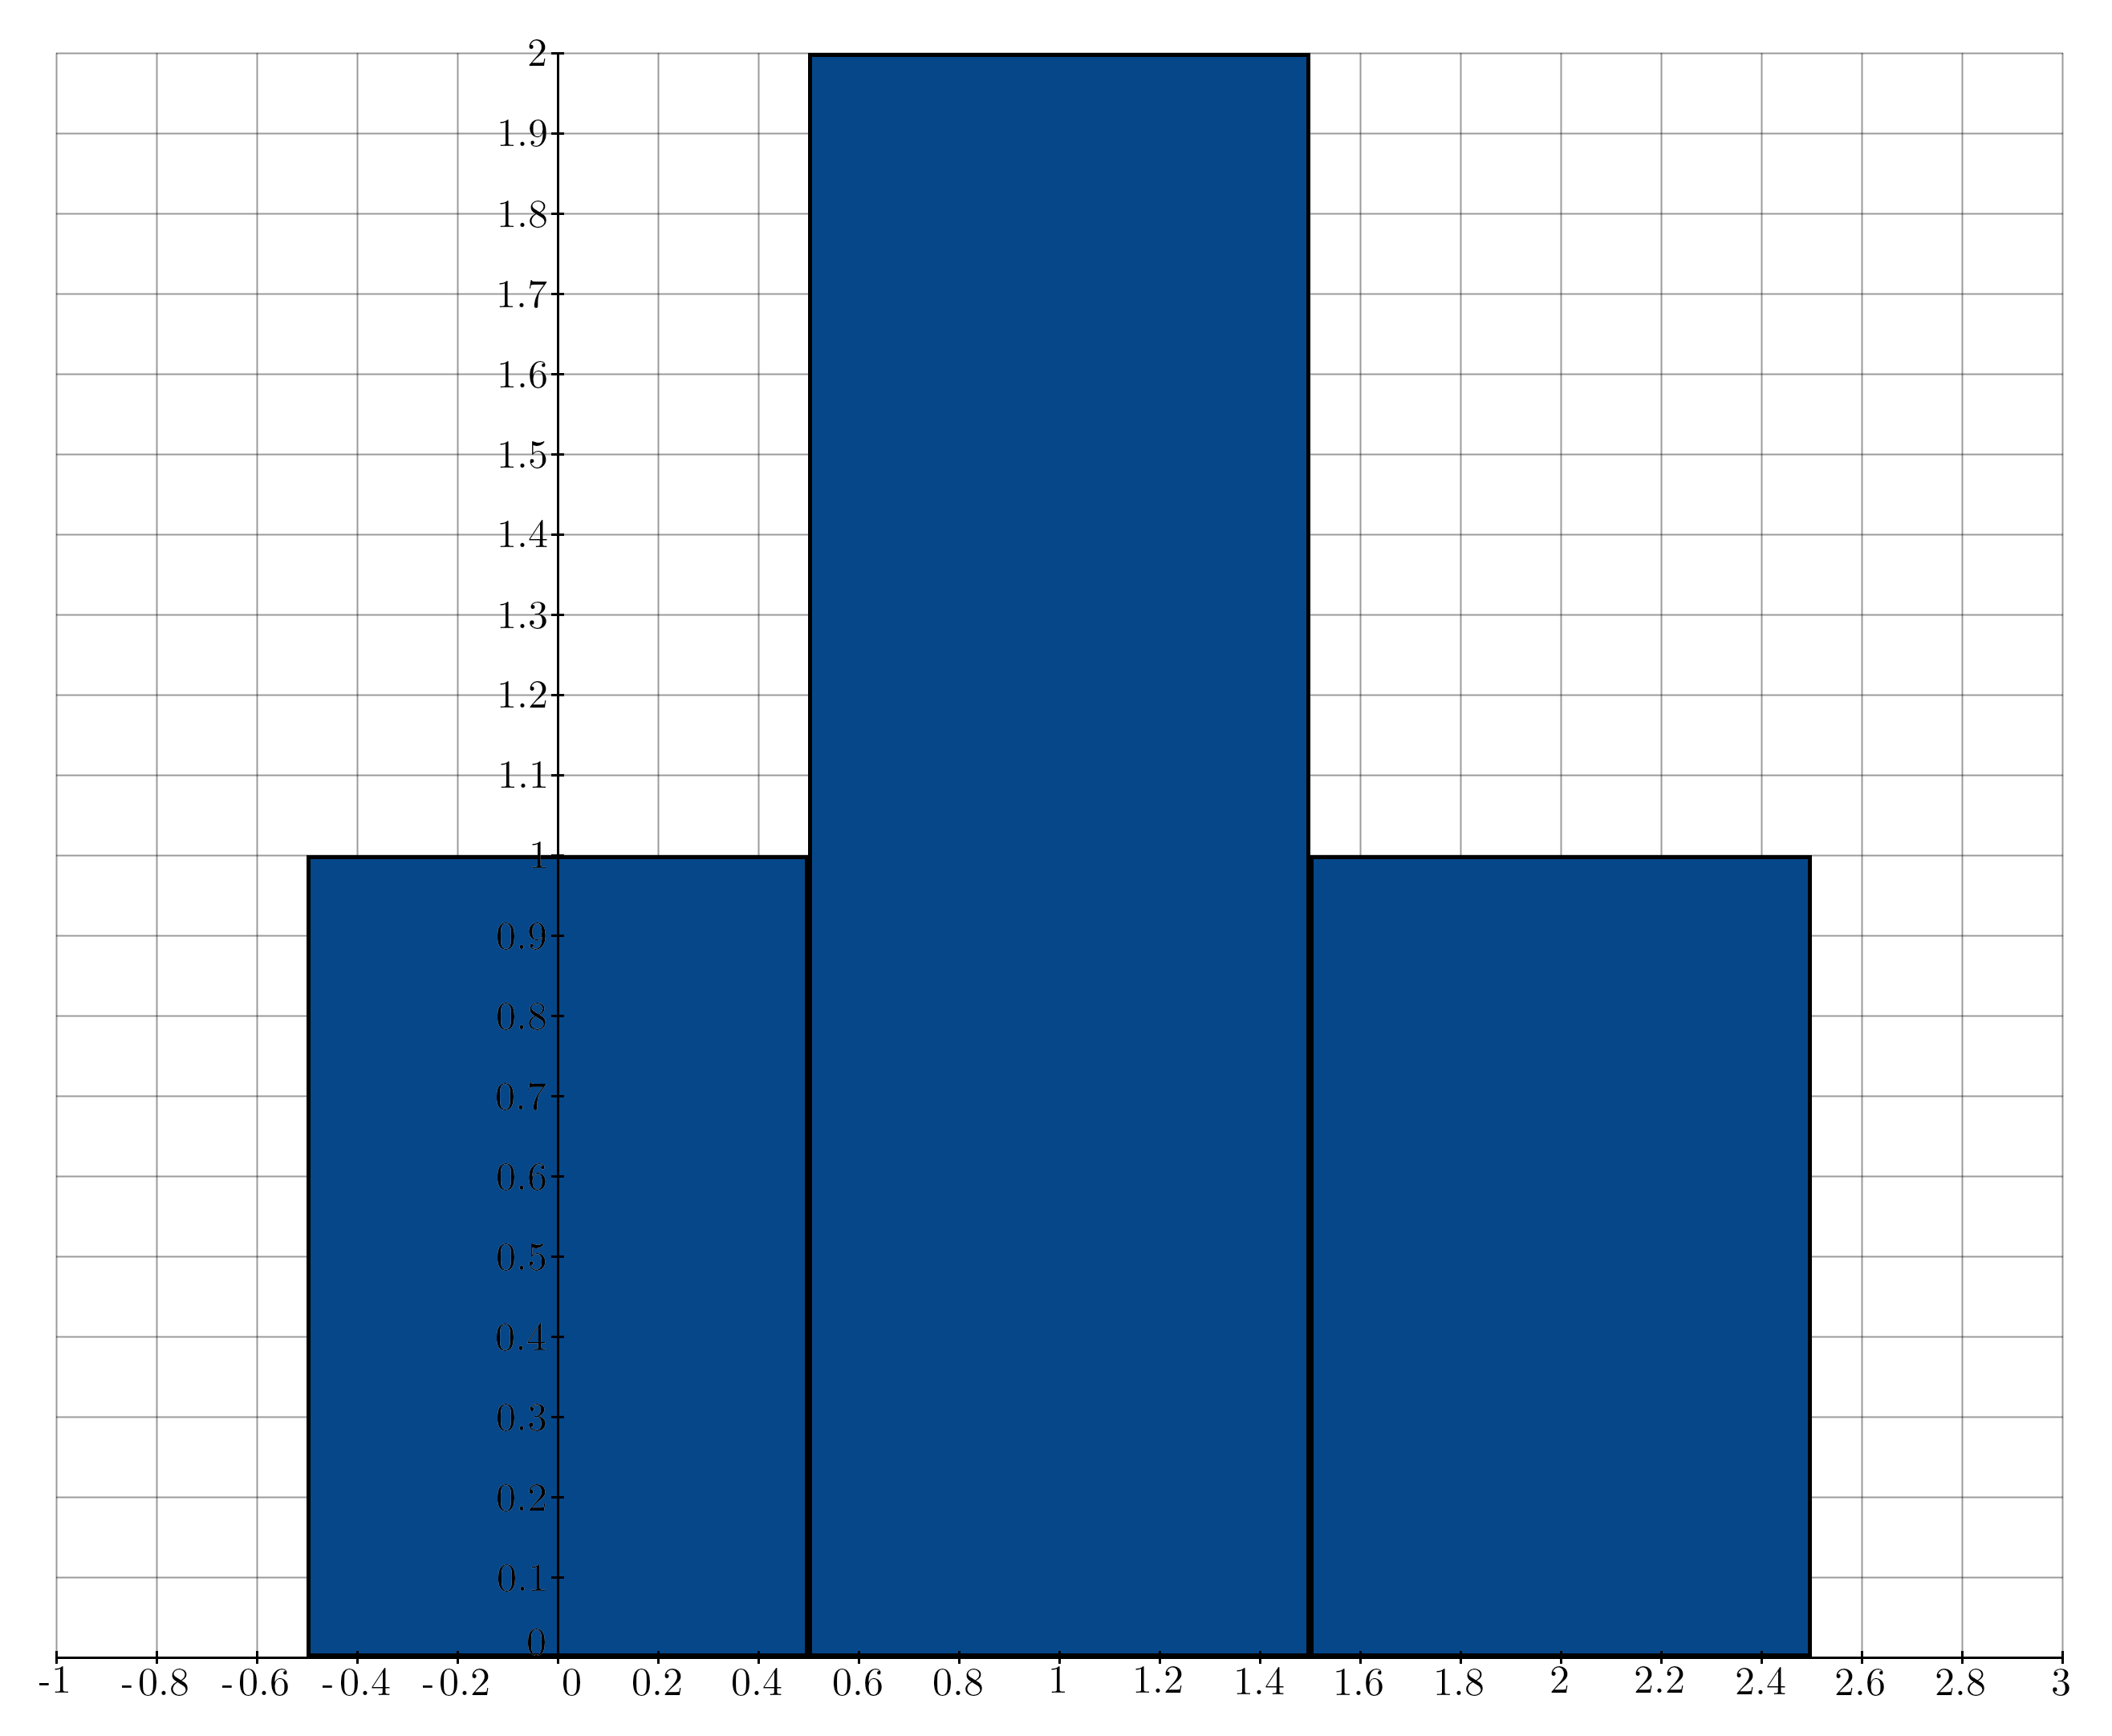
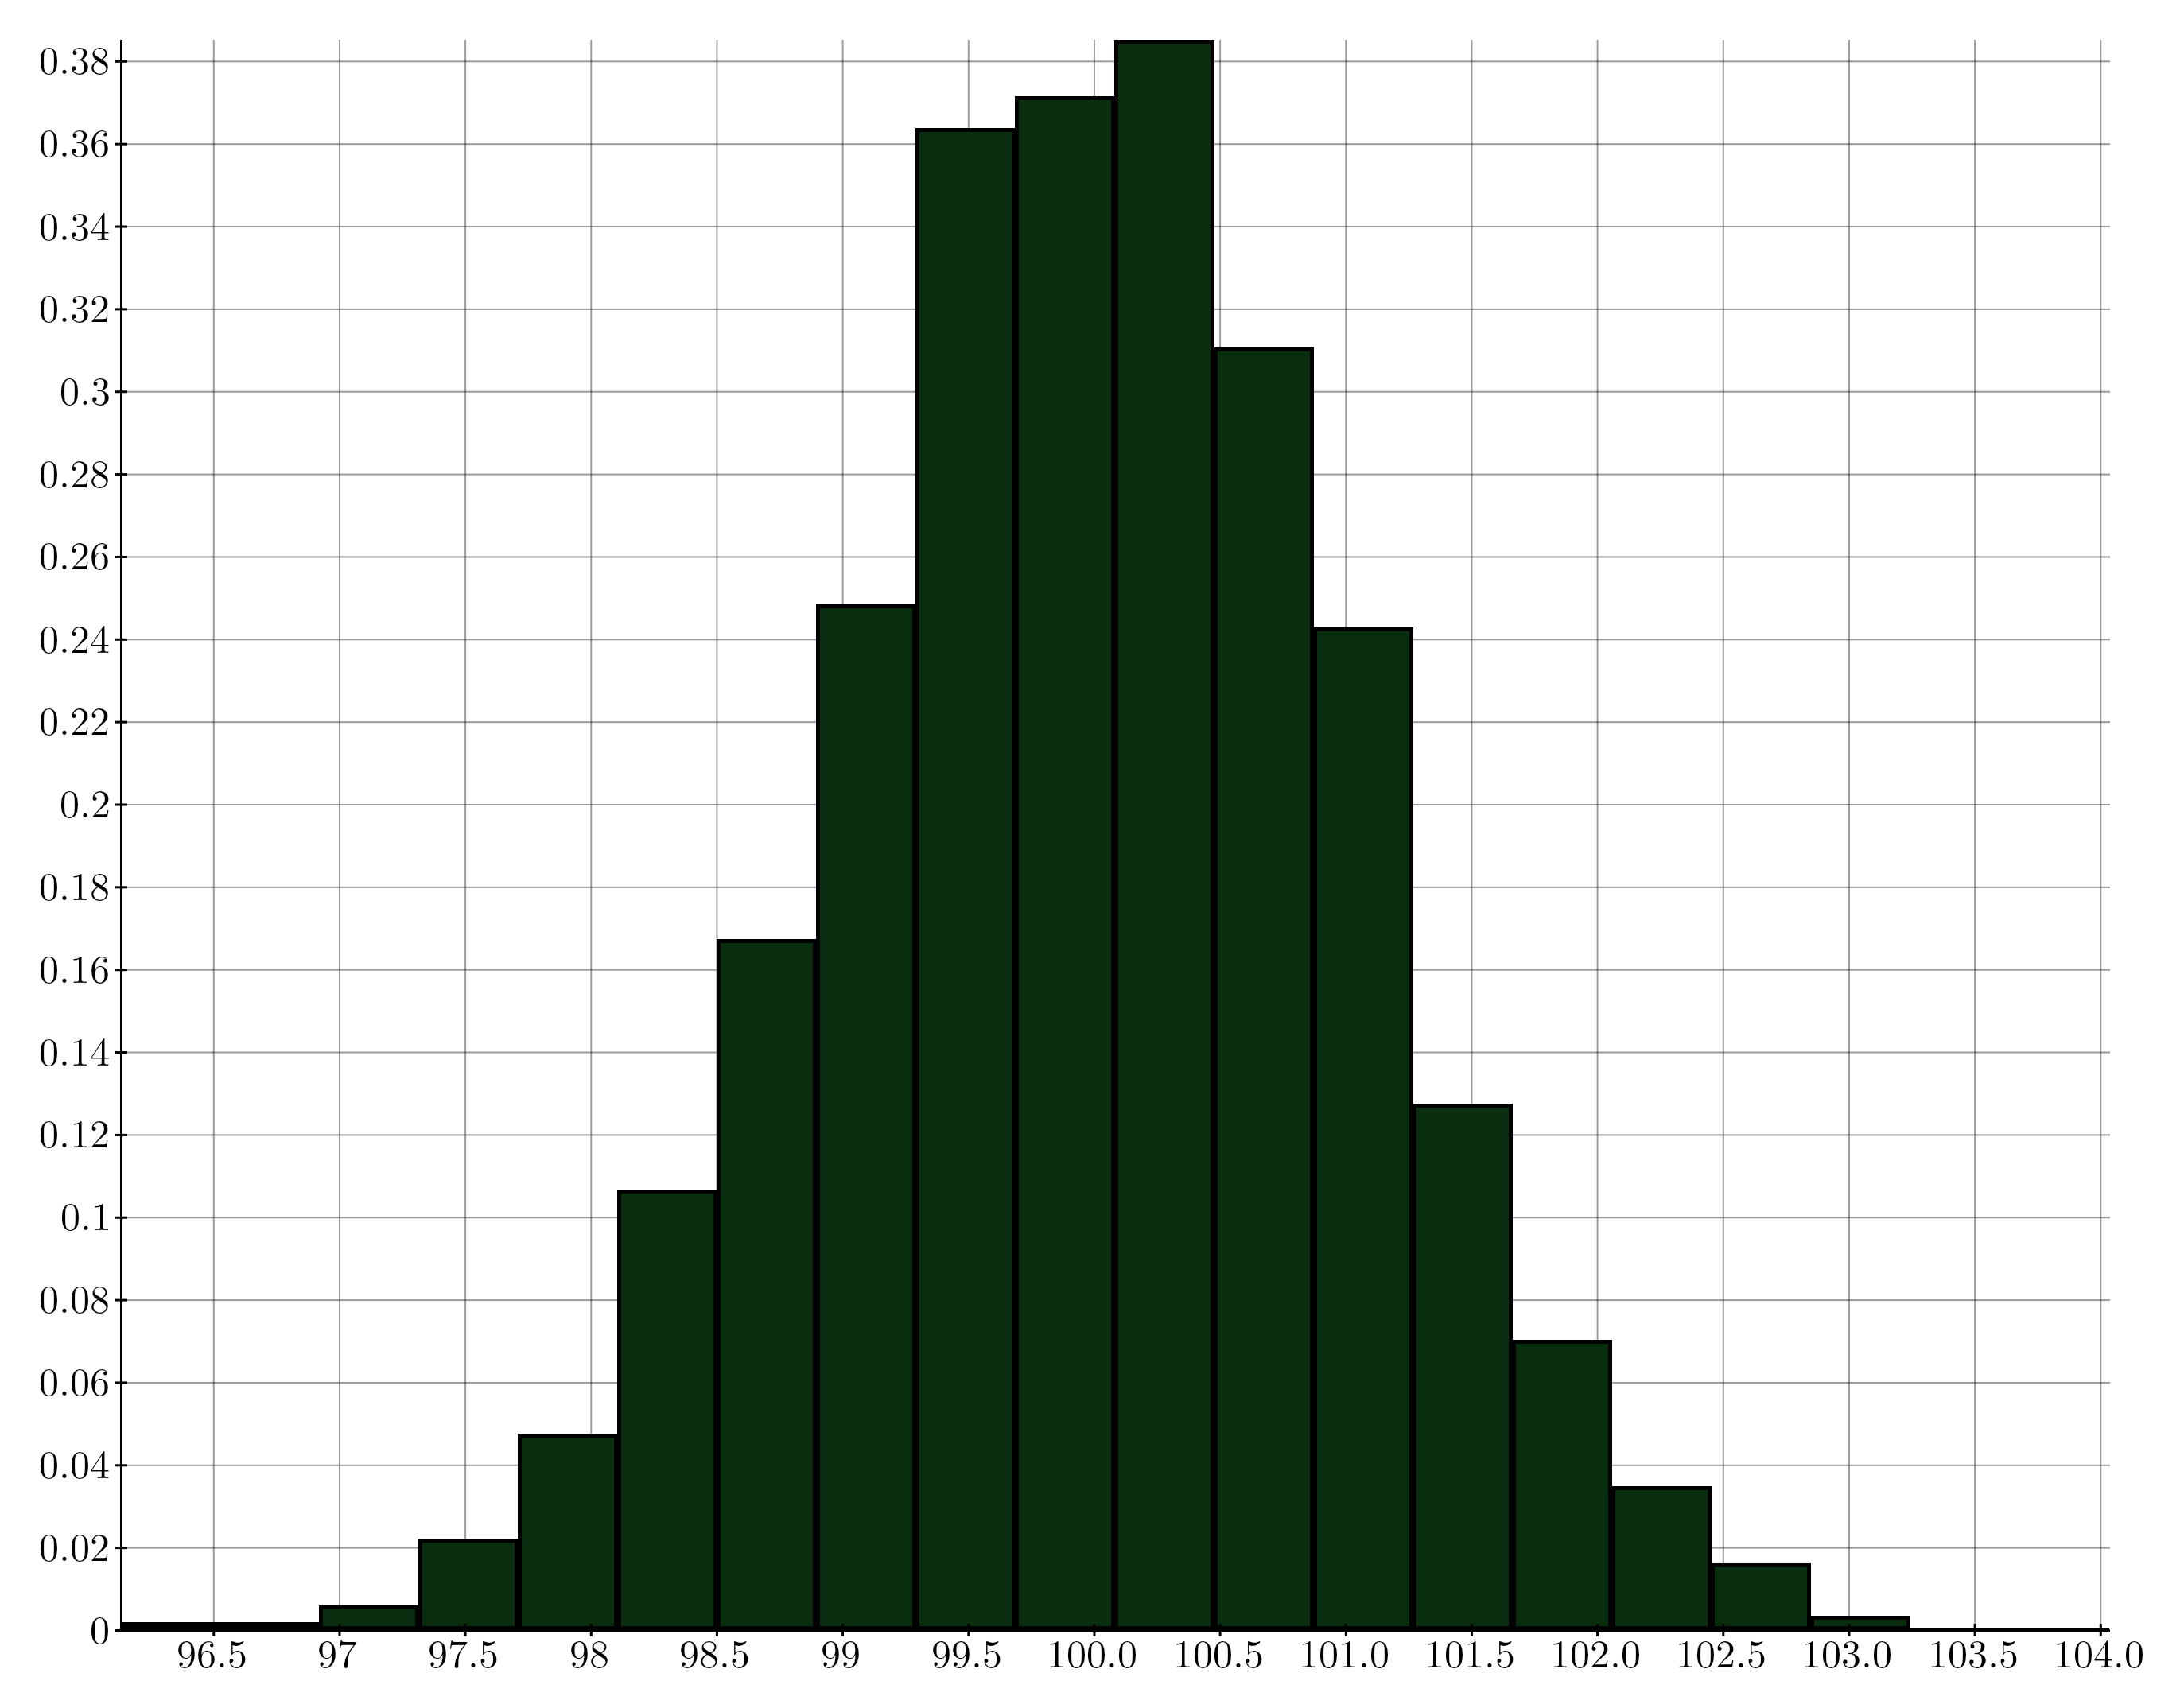
- class kaxe.Histogram(data: list, bins: int = 5, color: list = None, width: int = None, outlineColor: tuple = (0, 0, 0, 255), outlineWidth=5)
- class kaxe.Contour(func3D: LambdaType, a: int | float = -20, b: int | float = 20, steps: int | float = 15, colorMap: Colormap = None, lineThickness: int = 2, computePadding: int = 50, label: bool = True, labelSpacing: int = 80, labelCollisionPadding: int = 4, labelMinArc: int | None = None, labelMaxBranches: int = 1, labelMaxPerLevel: int = 8, labelColor=(0, 0, 0, 255))
A class used to represent a Contour.
- Parameters:
func3D (FunctionType) – A function that represents the 3D function to be contoured.
a (Union[int, float], optional) – The starting value for the contour range (default is -20).
b (Union[int, float], optional) – The ending value for the contour range (default is 20).
steps (Union[int, float], optional) – The number of steps in the contour (default is 15).
colorMap (Colormap, optional) – The colormap to be used for the contour (default is None, which uses the standard colormap).
lineThickness (int, optional) – The thickness of the contour lines (default is 10).
computePadding (int, optional) – When generating the contour equations some padding can be needed to include the edges properly (default is 50).
label (bool, optional) – Draw inline level labels on contour lines (default is True).
labelSpacing (int, optional) – Minimum pixel spacing between label candidates along a contour (default is 80).
labelCollisionPadding (int, optional) – Extra pixel gap required between placed label bounding boxes (default is 4).
labelMinArc (int, optional) – Minimum polyline arc length to consider for labels (default is labelSpacing).
labelMaxBranches (int, optional) – Maximum number of polylines per level to label (default is 1).
labelMaxPerLevel (int, optional) – Maximum labels per contour level (default is 8).
labelColor (tuple, optional) – Color of inline contour labels (default is black).
Examples
>>> def example_func(x, y):
>>>     return x**2 + y**2
>>> contour = Contour(example_func)
>>> plt.add(contour)

- legend(text: str, symbol='LINE', color=None)
Adds a legend
- Parameters:
text (str) – The text to be displayed in the legend.
symbol (symbols, optional) – The symbol to be used in the legend.
color (optional) – The color to be used for the legend text. If not provided, the default color will be used.
- Returns:
self – Returns the instance of the arrow object with the updated legend.
- Return type:
object
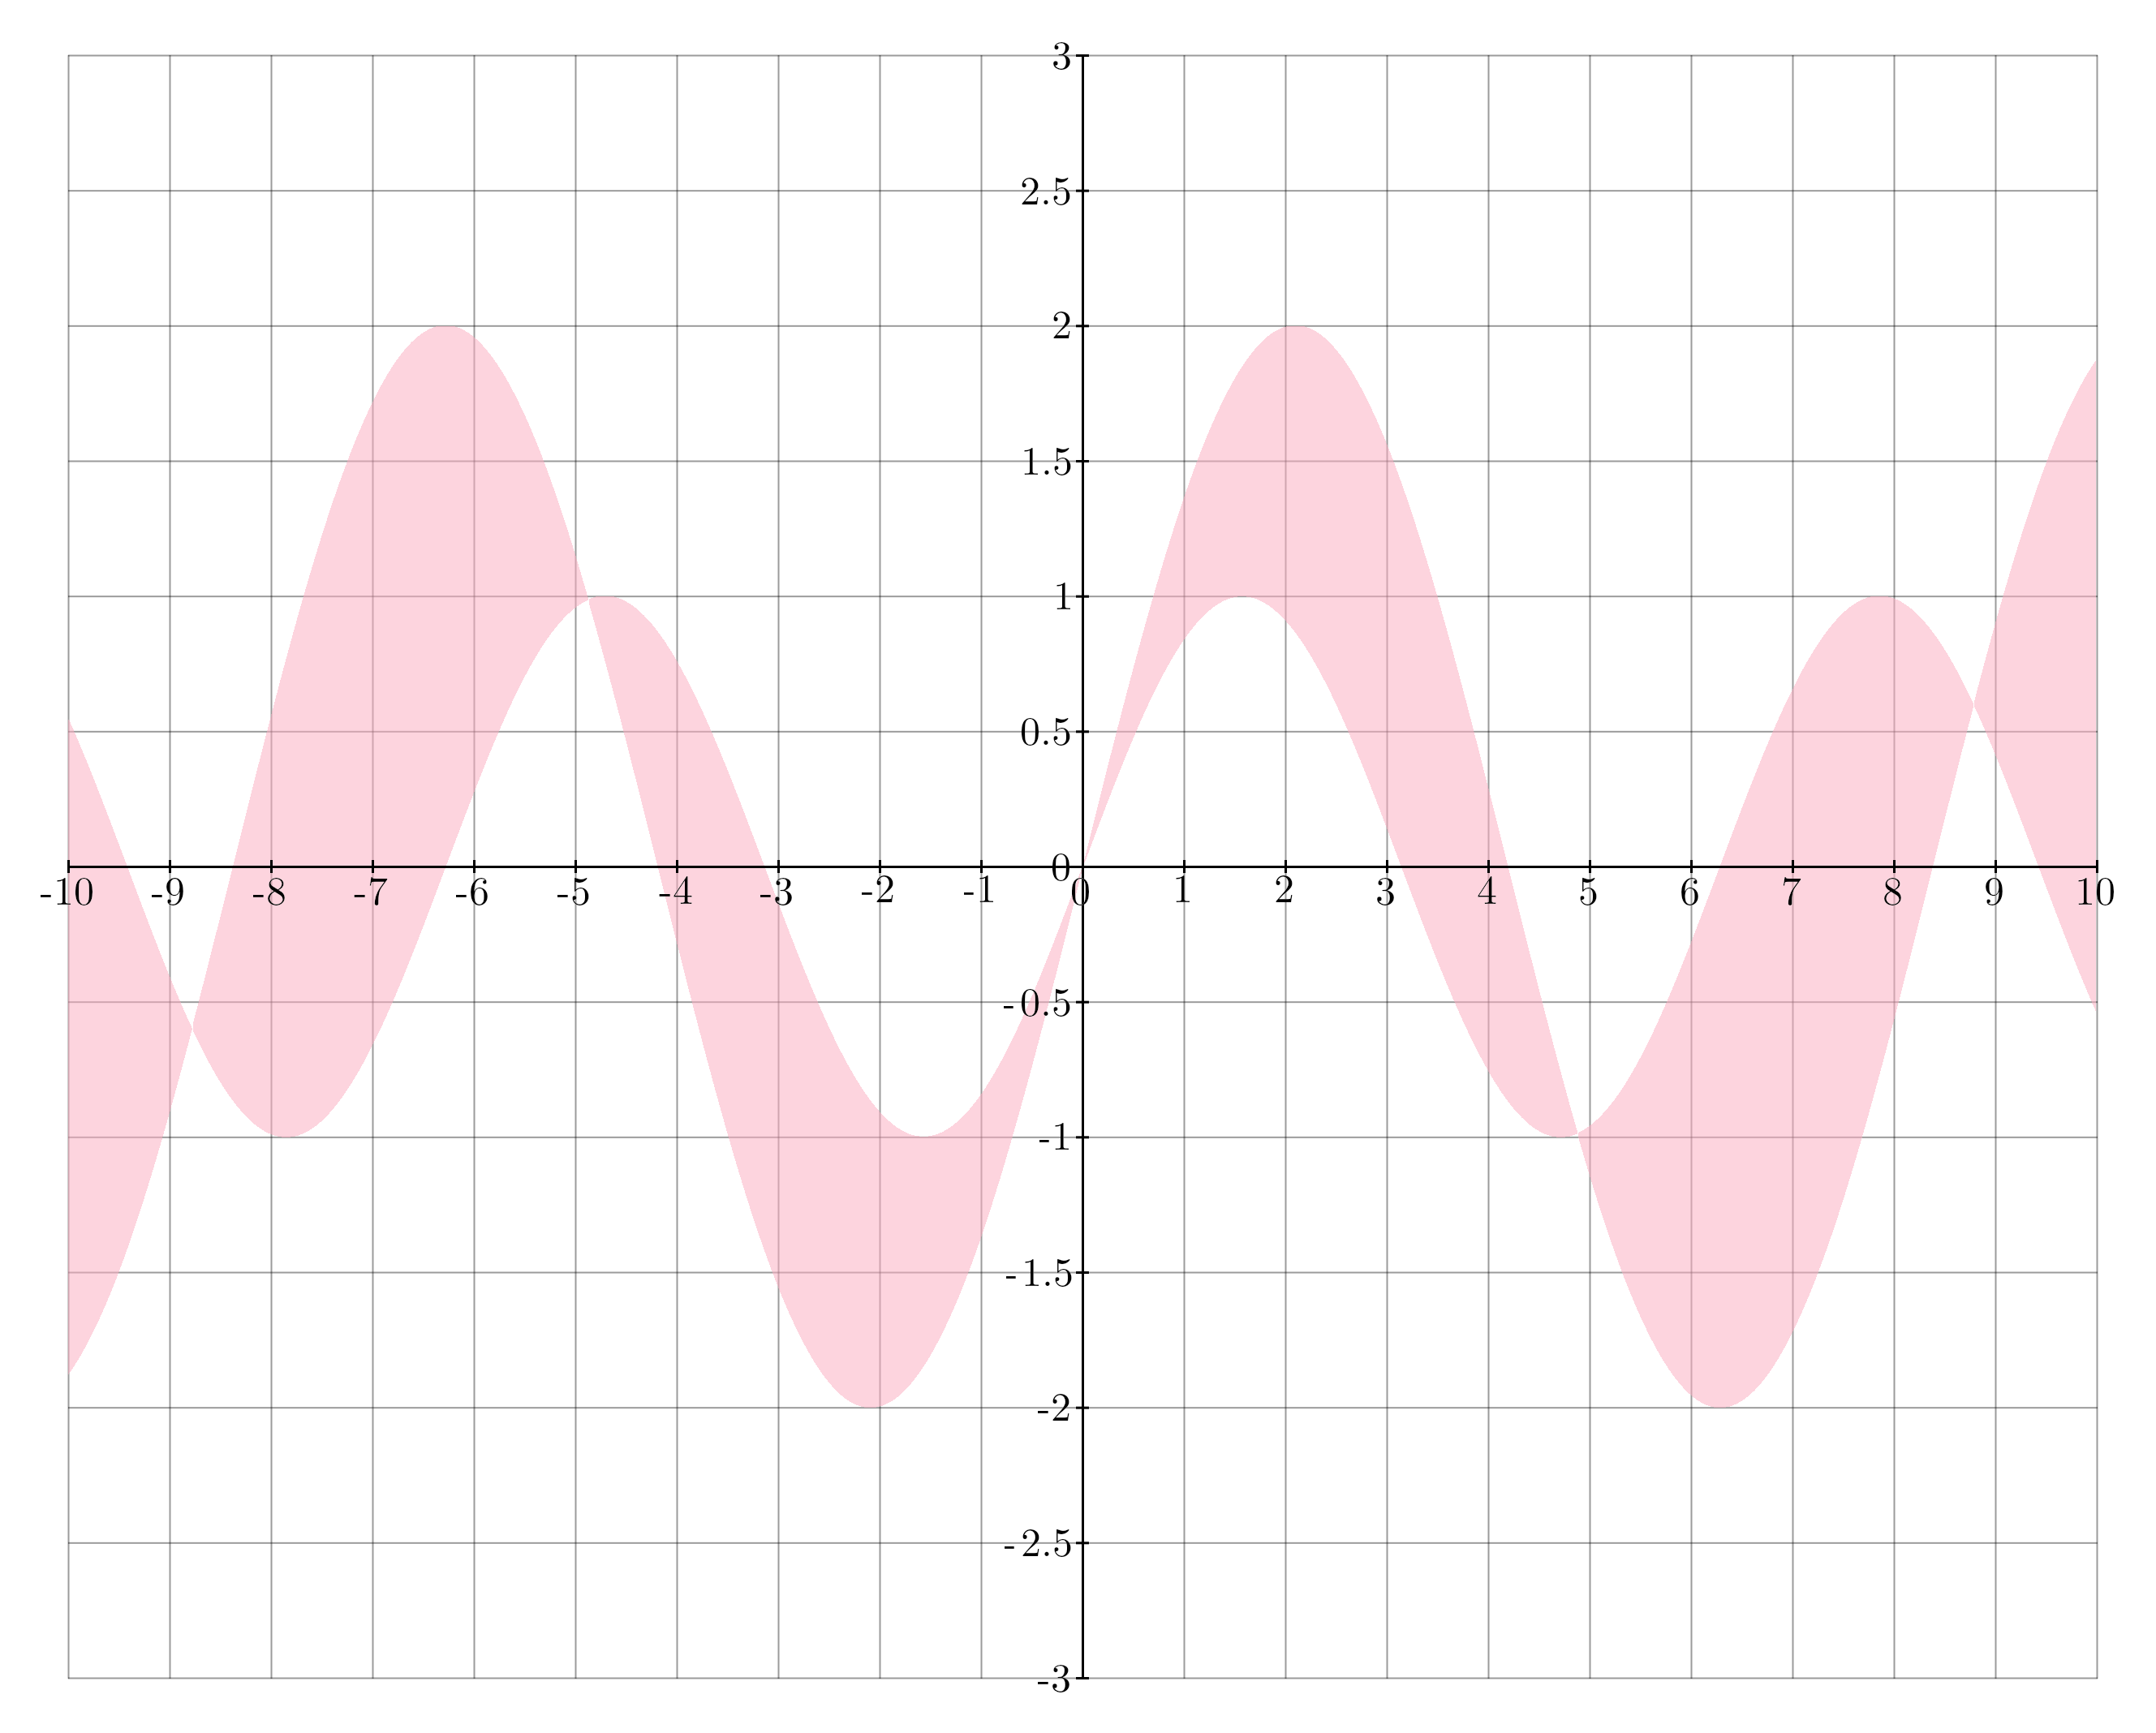
- class kaxe.Fill(f: LambdaType, g: LambdaType = None, color: list | tuple = None)
A class used to represent a Fill between two functions.
- Parameters:
f (FunctionType) – First function to fill between
g (FunctionType, optional) – Second function to fill between. If None is given g(x)=0 is used.
color (Union[list, tuple], optional) – Color of the fill. If None, a random color with transparency is used.
Examples
>>> f = lambda x: x**2
>>> g = lambda x: x
>>> fill = kaxe.Fill(f, g)
>>> plt.add( fill )
See also
kaxe.Function2D().fill()
Notes
When a fill is not wanted set create f(x) and g(x) so f(x)=g(x) in the wished interval This object can also be used to fill between discrete points but the user will have to create the function. This could be achived through Zero-order-hold, interpolation or regression.
- legend(text: str, symbol='RECT', color=None)
Adds a legend
- Parameters:
text (str) – The text to be displayed in the legend.
symbol (symbols, optional) – The symbol to be used in the legend.
color (optional) – The color to be used for the legend text. If not provided, the default color will be used.
- Returns:
self – Returns the instance of the arrow object with the updated legend.
- Return type:
object
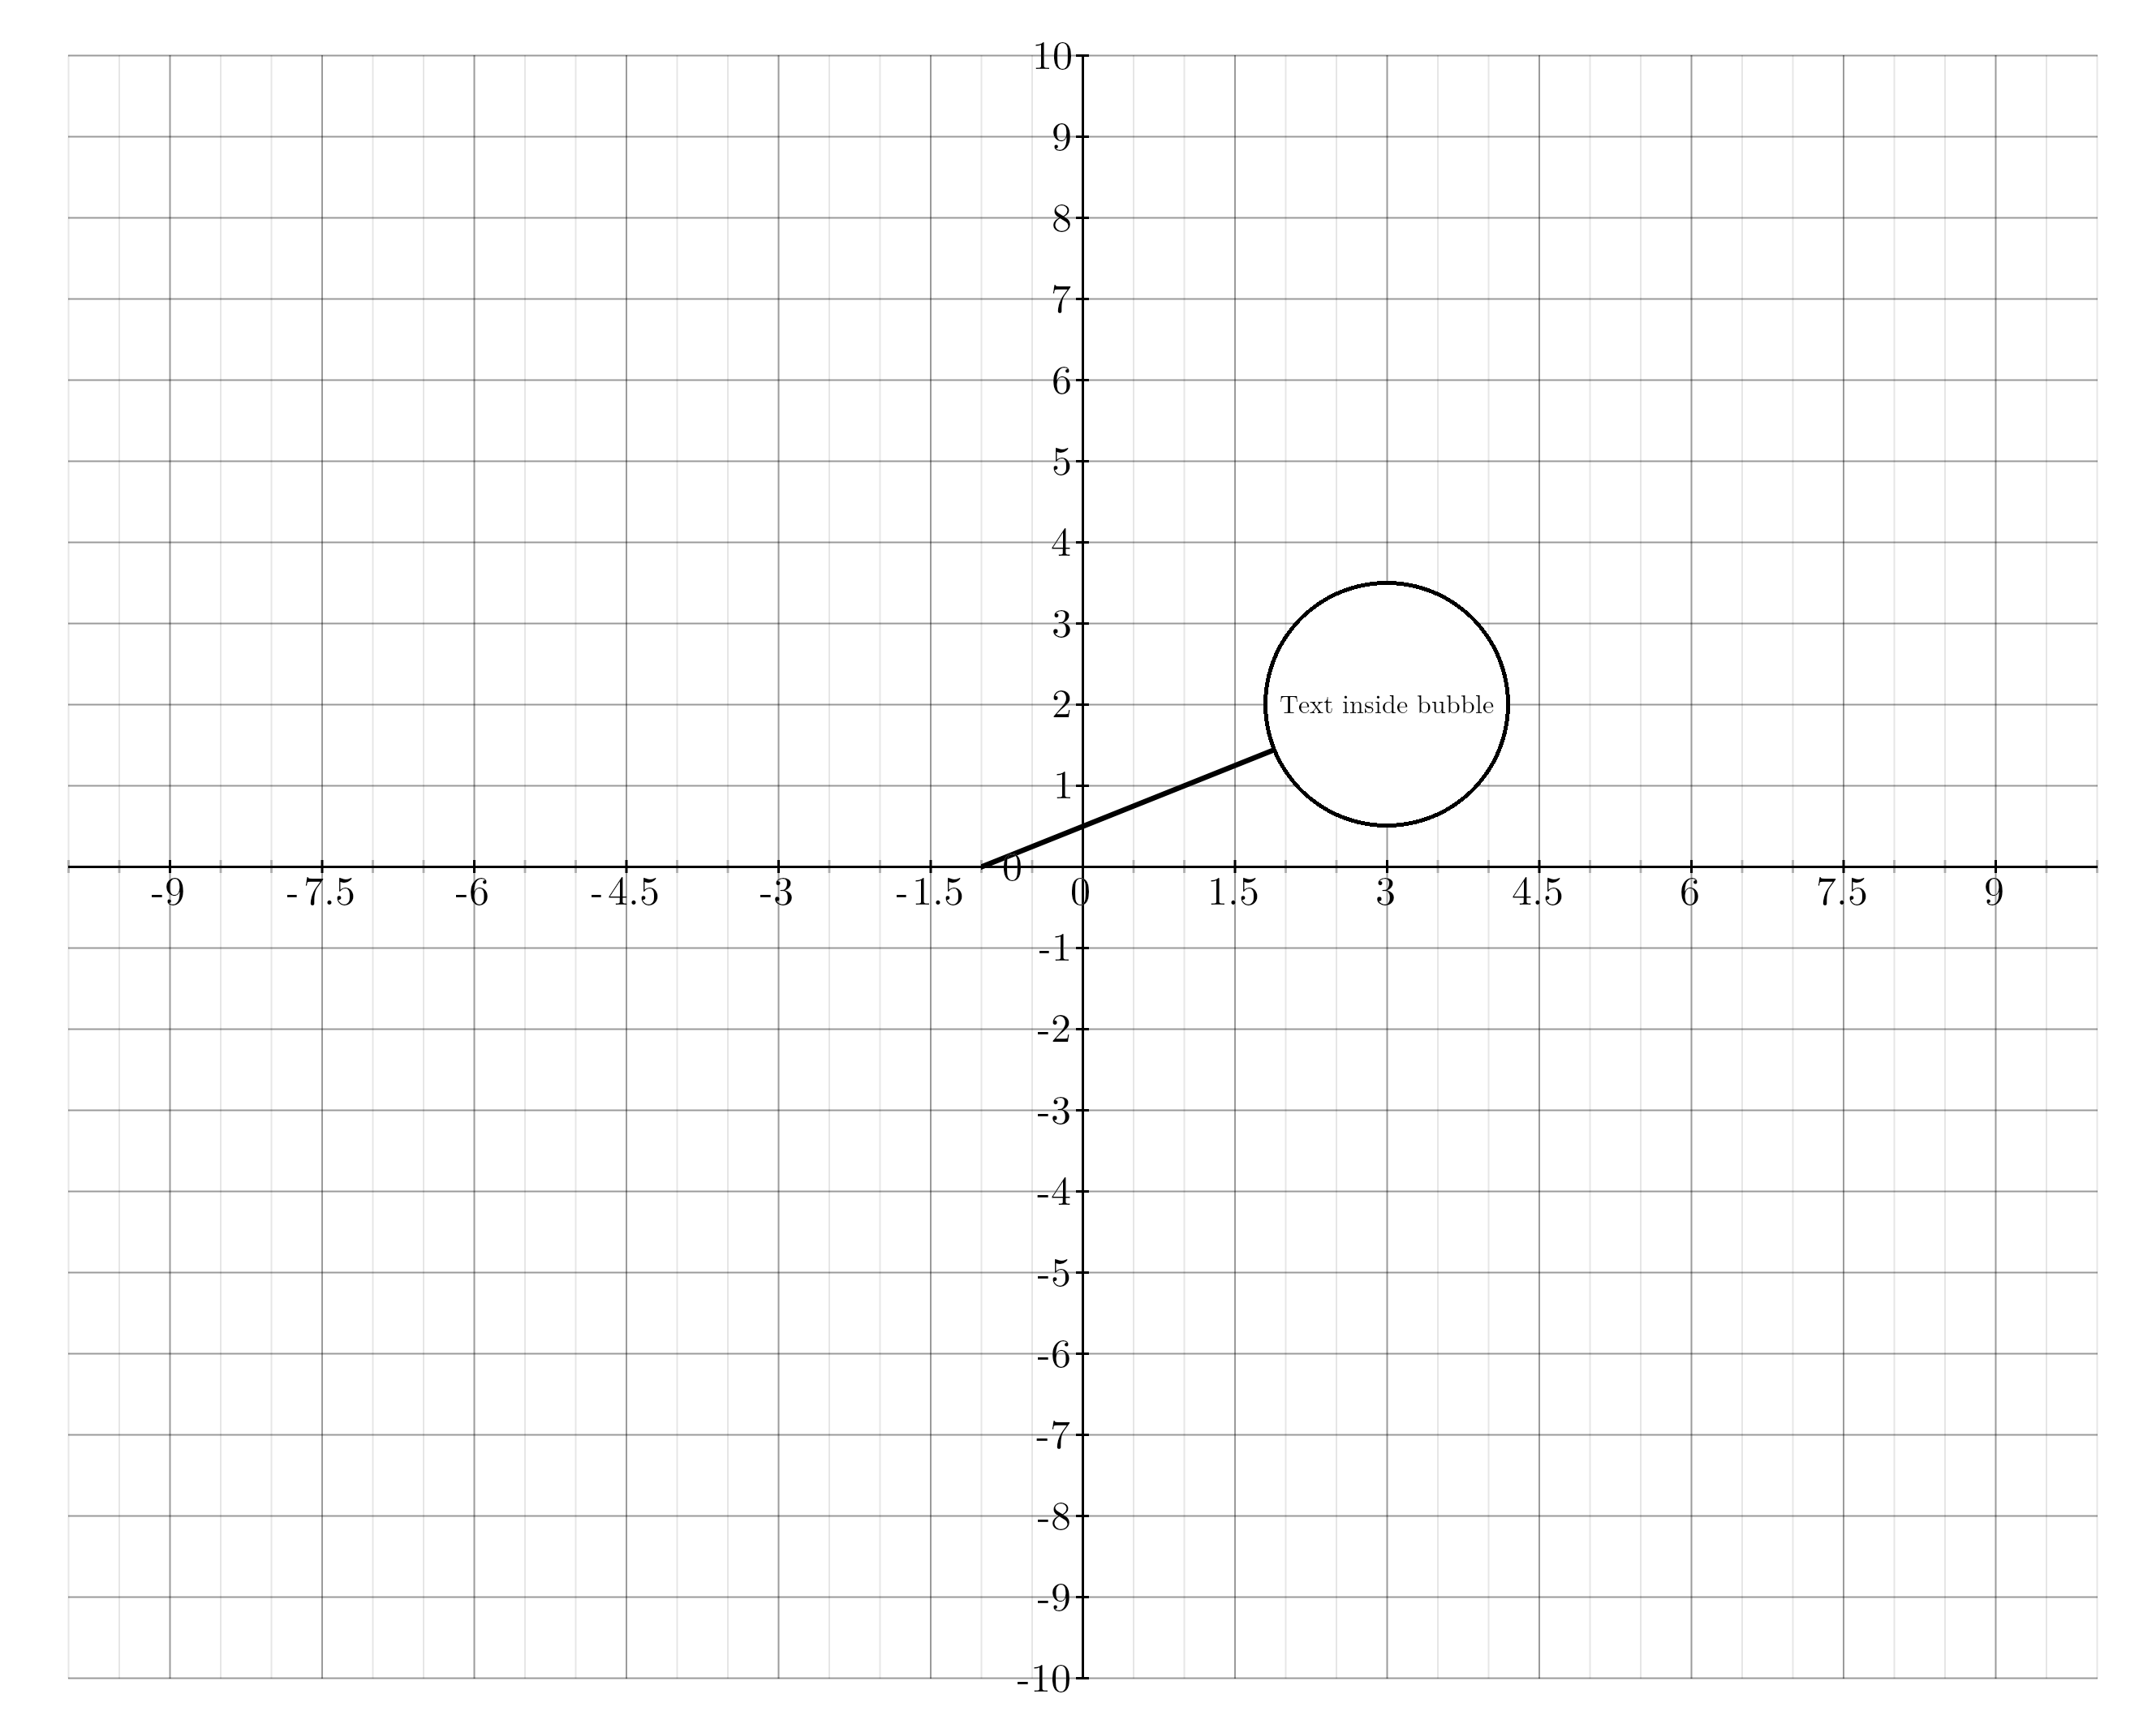
- class kaxe.Bubble(text: str, centerPos, lineEndPos, color: tuple = (0, 0, 0, 255), lineThickness: int = 5, fontSize: int = 32, backgroundColor=(255, 255, 255, 255), outlineColor=(0, 0, 0, 255), padding=10)
A class to represent a bubble with text and a line pointing to it.
- Parameters:
text (str) – The text to be displayed inside the bubble.
centerPos (tuple) – The (x, y) coordinates of the center position of the bubble.
lineEndPos (tuple) – The (x, y) coordinates of the end position of the line pointing to the bubble.
color (tuple, optional) – The color of the bubble in RGB format, by default BLACK.
lineThickness (int, optional) – The thickness of the line pointing to the bubble, by default 5.
fontSize (int, optional) – The font size of the text inside the bubble, by default 32.
backgroundColor (tuple, optional) – The background color of the bubble in RGB format, by default WHITE.
Examples
>>> plt.add( Bubble("kaxe is cool", (0,1), (2, 5)) )
- legend(text: str, symbol='LINE', color=None)
Adds a legend
- Parameters:
text (str) – The text to be displayed in the legend.
symbol (symbols, optional) – The symbol to be used in the legend.
color (optional) – The color to be used for the legend text. If not provided, the default color will be used.
- Returns:
self – Returns the instance of the arrow object with the updated legend.
- Return type:
object
- class kaxe.objects.text.Text(text, center, color: tuple = None)
Place a text label at a data coordinate on a plot.
- Parameters:
text (str) – Label text. LaTeX math is supported when wrapped in
$...$.center (tuple) –
(x, y)or(x, y, z)position in data coordinates.color (tuple, optional) – RGBA color. A random cycle color is used when omitted.
Examples
>>> import kaxe
>>> plt = kaxe.Plot([-1, 1, -1, 1])
>>> plt.add(kaxe.objects.text.Text("$\alpha$", (0, 0)))
3D objects
3D objects are lazy-loaded and require a 3D plot window (kaxe.Plot3D, kaxe.PlotCenter3D, or kaxe.PlotFrame3D).
- class kaxe.Points3D(x, y, z, color: tuple = None, size: int = 5, connect: bool = False)
Create 3D points
- Parameters:
x (list) – List of x-coordinates.
y (list) – List of y-coordinates.
z (list) – List of z-coordinates.
color (Colormap, optional) – ColorMap for colors
size (int, optional) – Size of the point. Default is 5.
connect (bool, optional) – Whether the points should be connected. Default is False.
- legend(text: str, color=None, symbol='o')
Adds a legend
- Parameters:
text (str) – The text to be displayed in the legend.
symbol (symbols, optional) – The symbol to be used in the legend.
color (optional) – The color to be used for the legend text. If not provided, the default color will be used.
- Returns:
self – Returns the instance of the arrow object with the updated legend.
- Return type:
object
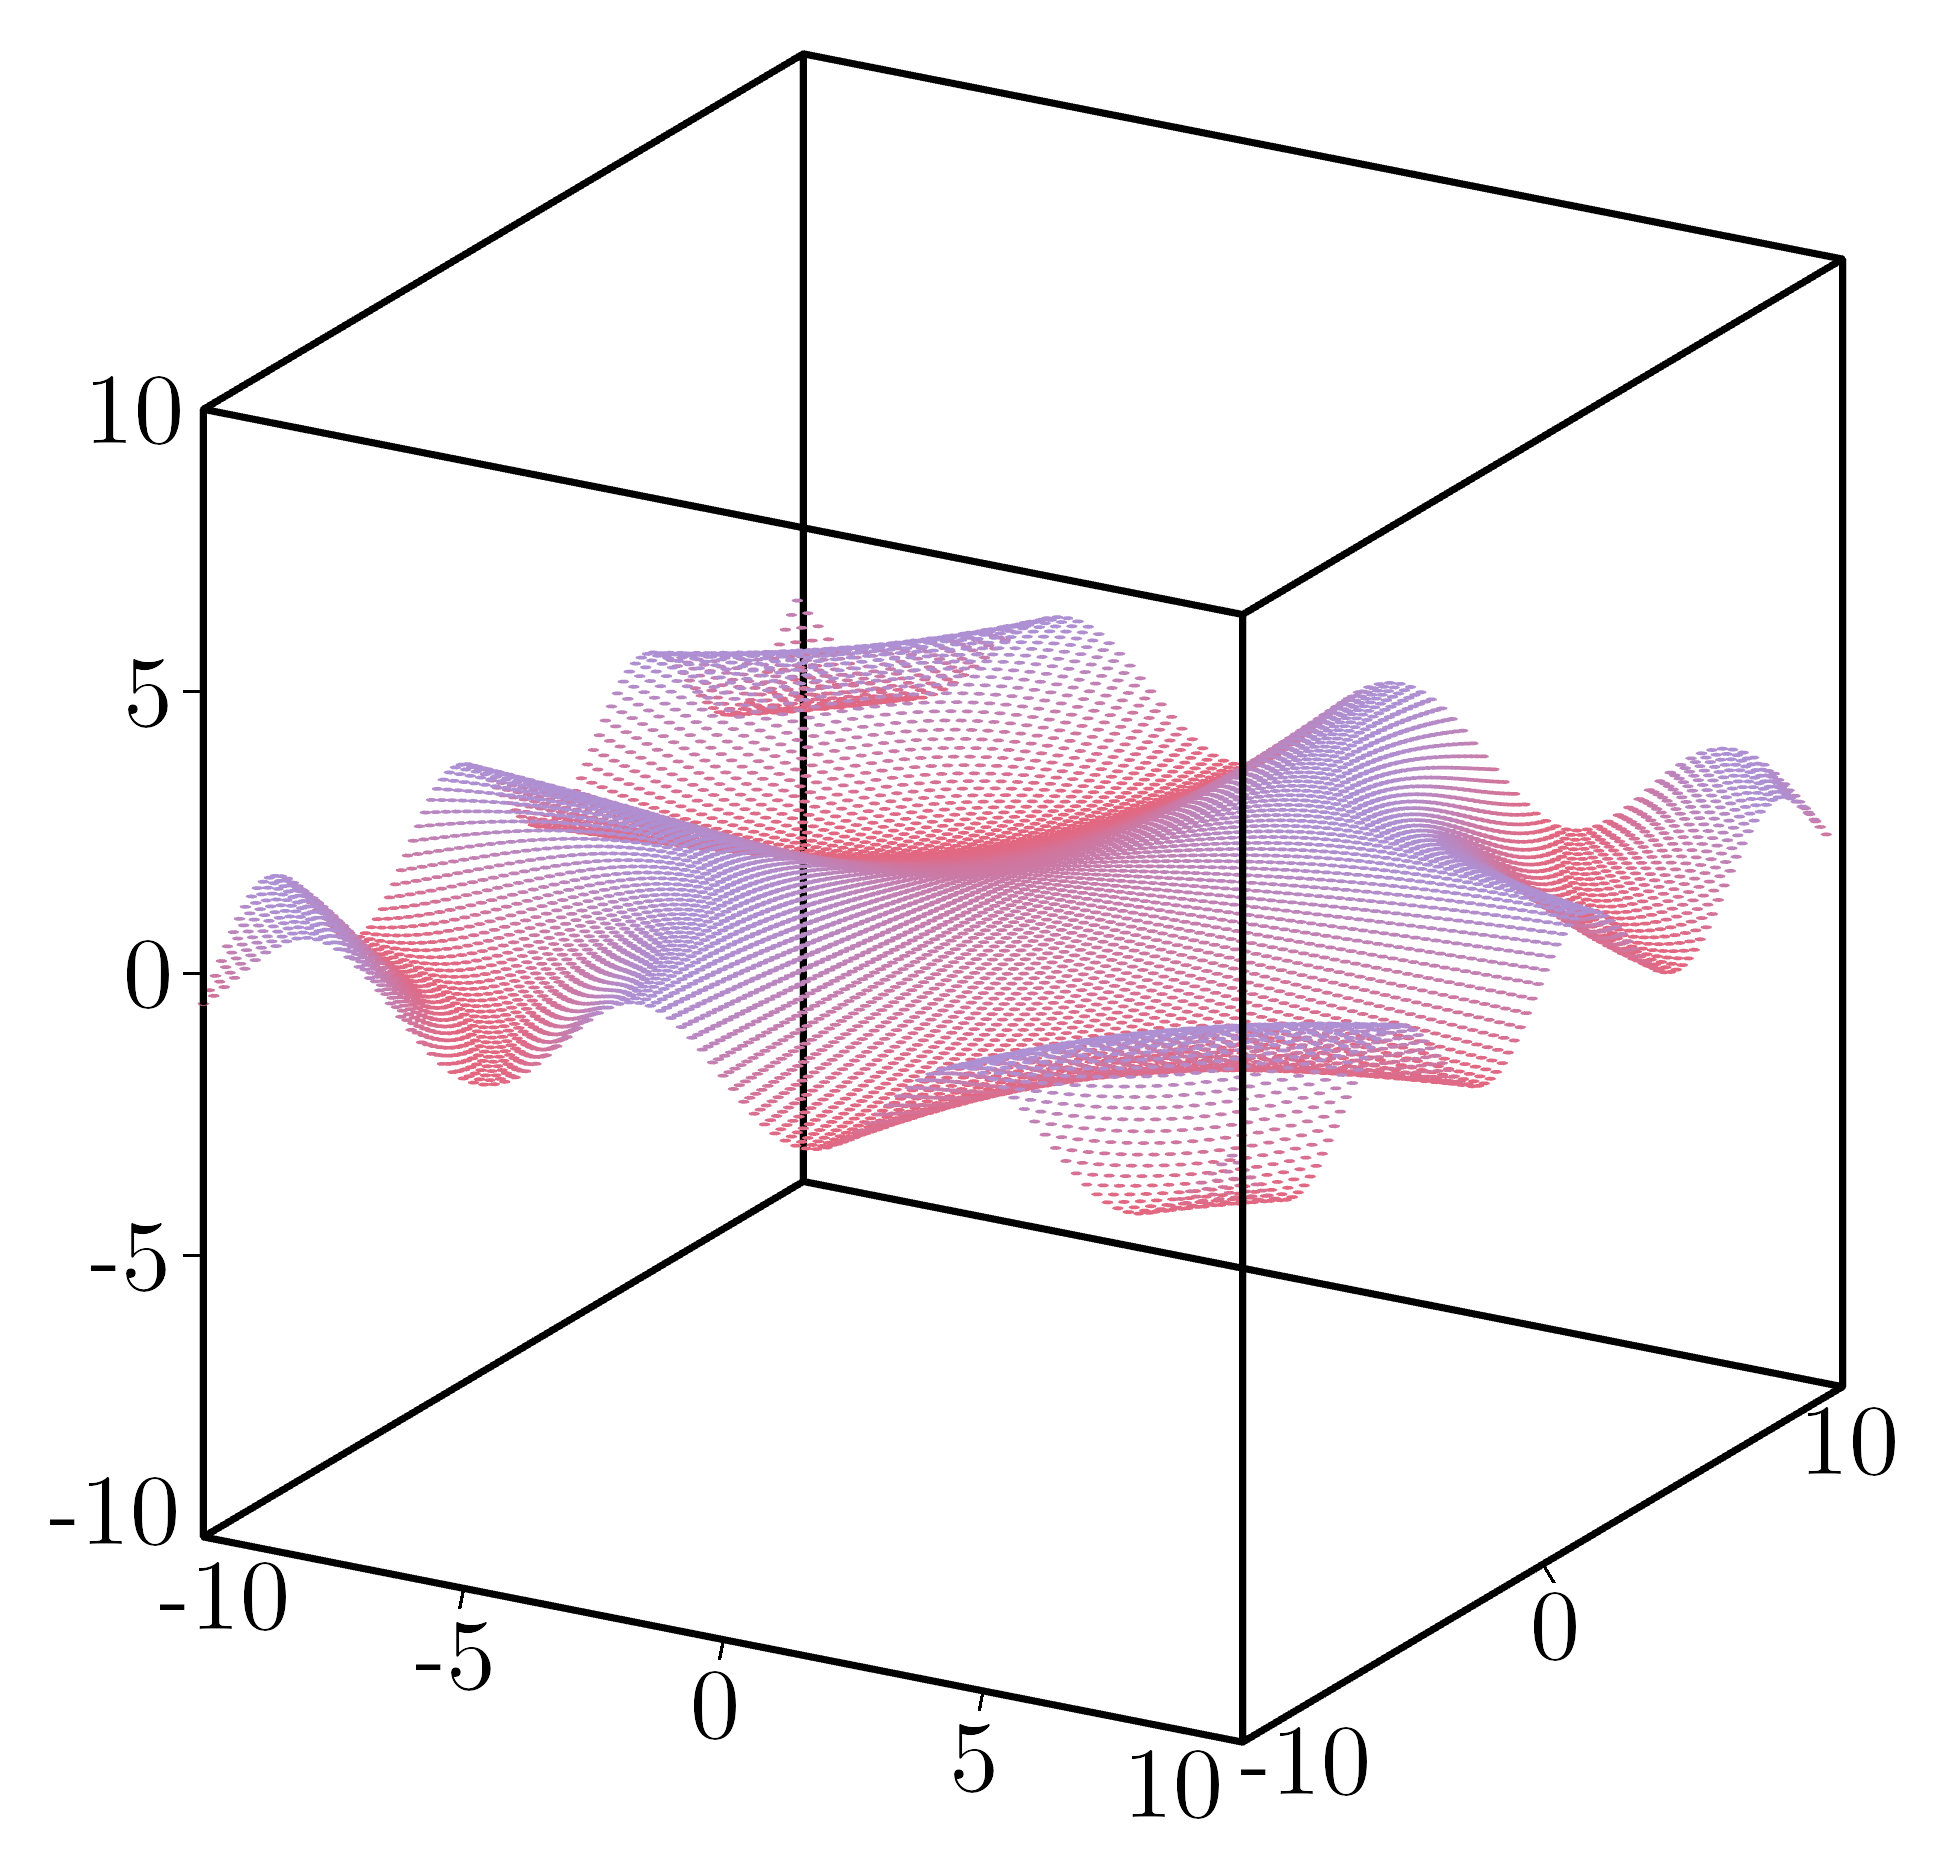
- class kaxe.Function3D(f, color: Colormap = None, numPoints: int = None, fill: bool = True, drawDiagonalLines: bool = False, axis='xy', excludeLight=True, domain: Sequence[float] | None = None, range: Sequence[float] | None = None, *args, **kwargs)
Create a Function in 3D given .. math:: z=f(x,y)
- Parameters:
f (callable) – The function to be plotted.
color (Colormap, optional) – The colormap to be used for plotting. If None, the standard colormap is used.
numPoints (int, optional) – The number of points to be used for plotting. If None, defaults to 500 if fill is True, otherwise 25.
fill (bool) – Whether to fill the plot. default is True
drawDiagonalLines (bool) – Whether to draw diagonal lines in triangles when fill is False. default is False
domain (tuple, optional) – Sampling interval for the two independent axes. For
axis="xy"this is(x0, x1, y0, y1); foraxis="xz"it is(x0, x1, z0, z1); foraxis="yz"it is(y0, y1, z0, z1). Defaults to(-10, 10)on each independent axis when the plot window does not fix them.range (tuple, optional) – Fixed interval
(lo, hi)on the dependent axis (z foraxis="xy", y foraxis="xz", x foraxis="yz").excludeLight (bool, optional) – Whether to exclude lighting effects. Default is True.
- __call__(x)
Evaluates the function at a given x value.
When the plot window leaves an axis as
None,kaxe.Function3Destimates bounds by coarse sampling over the independent variables. Usedomainfor the sampling box andrangeto pin the dependent axis (z foraxis="xy").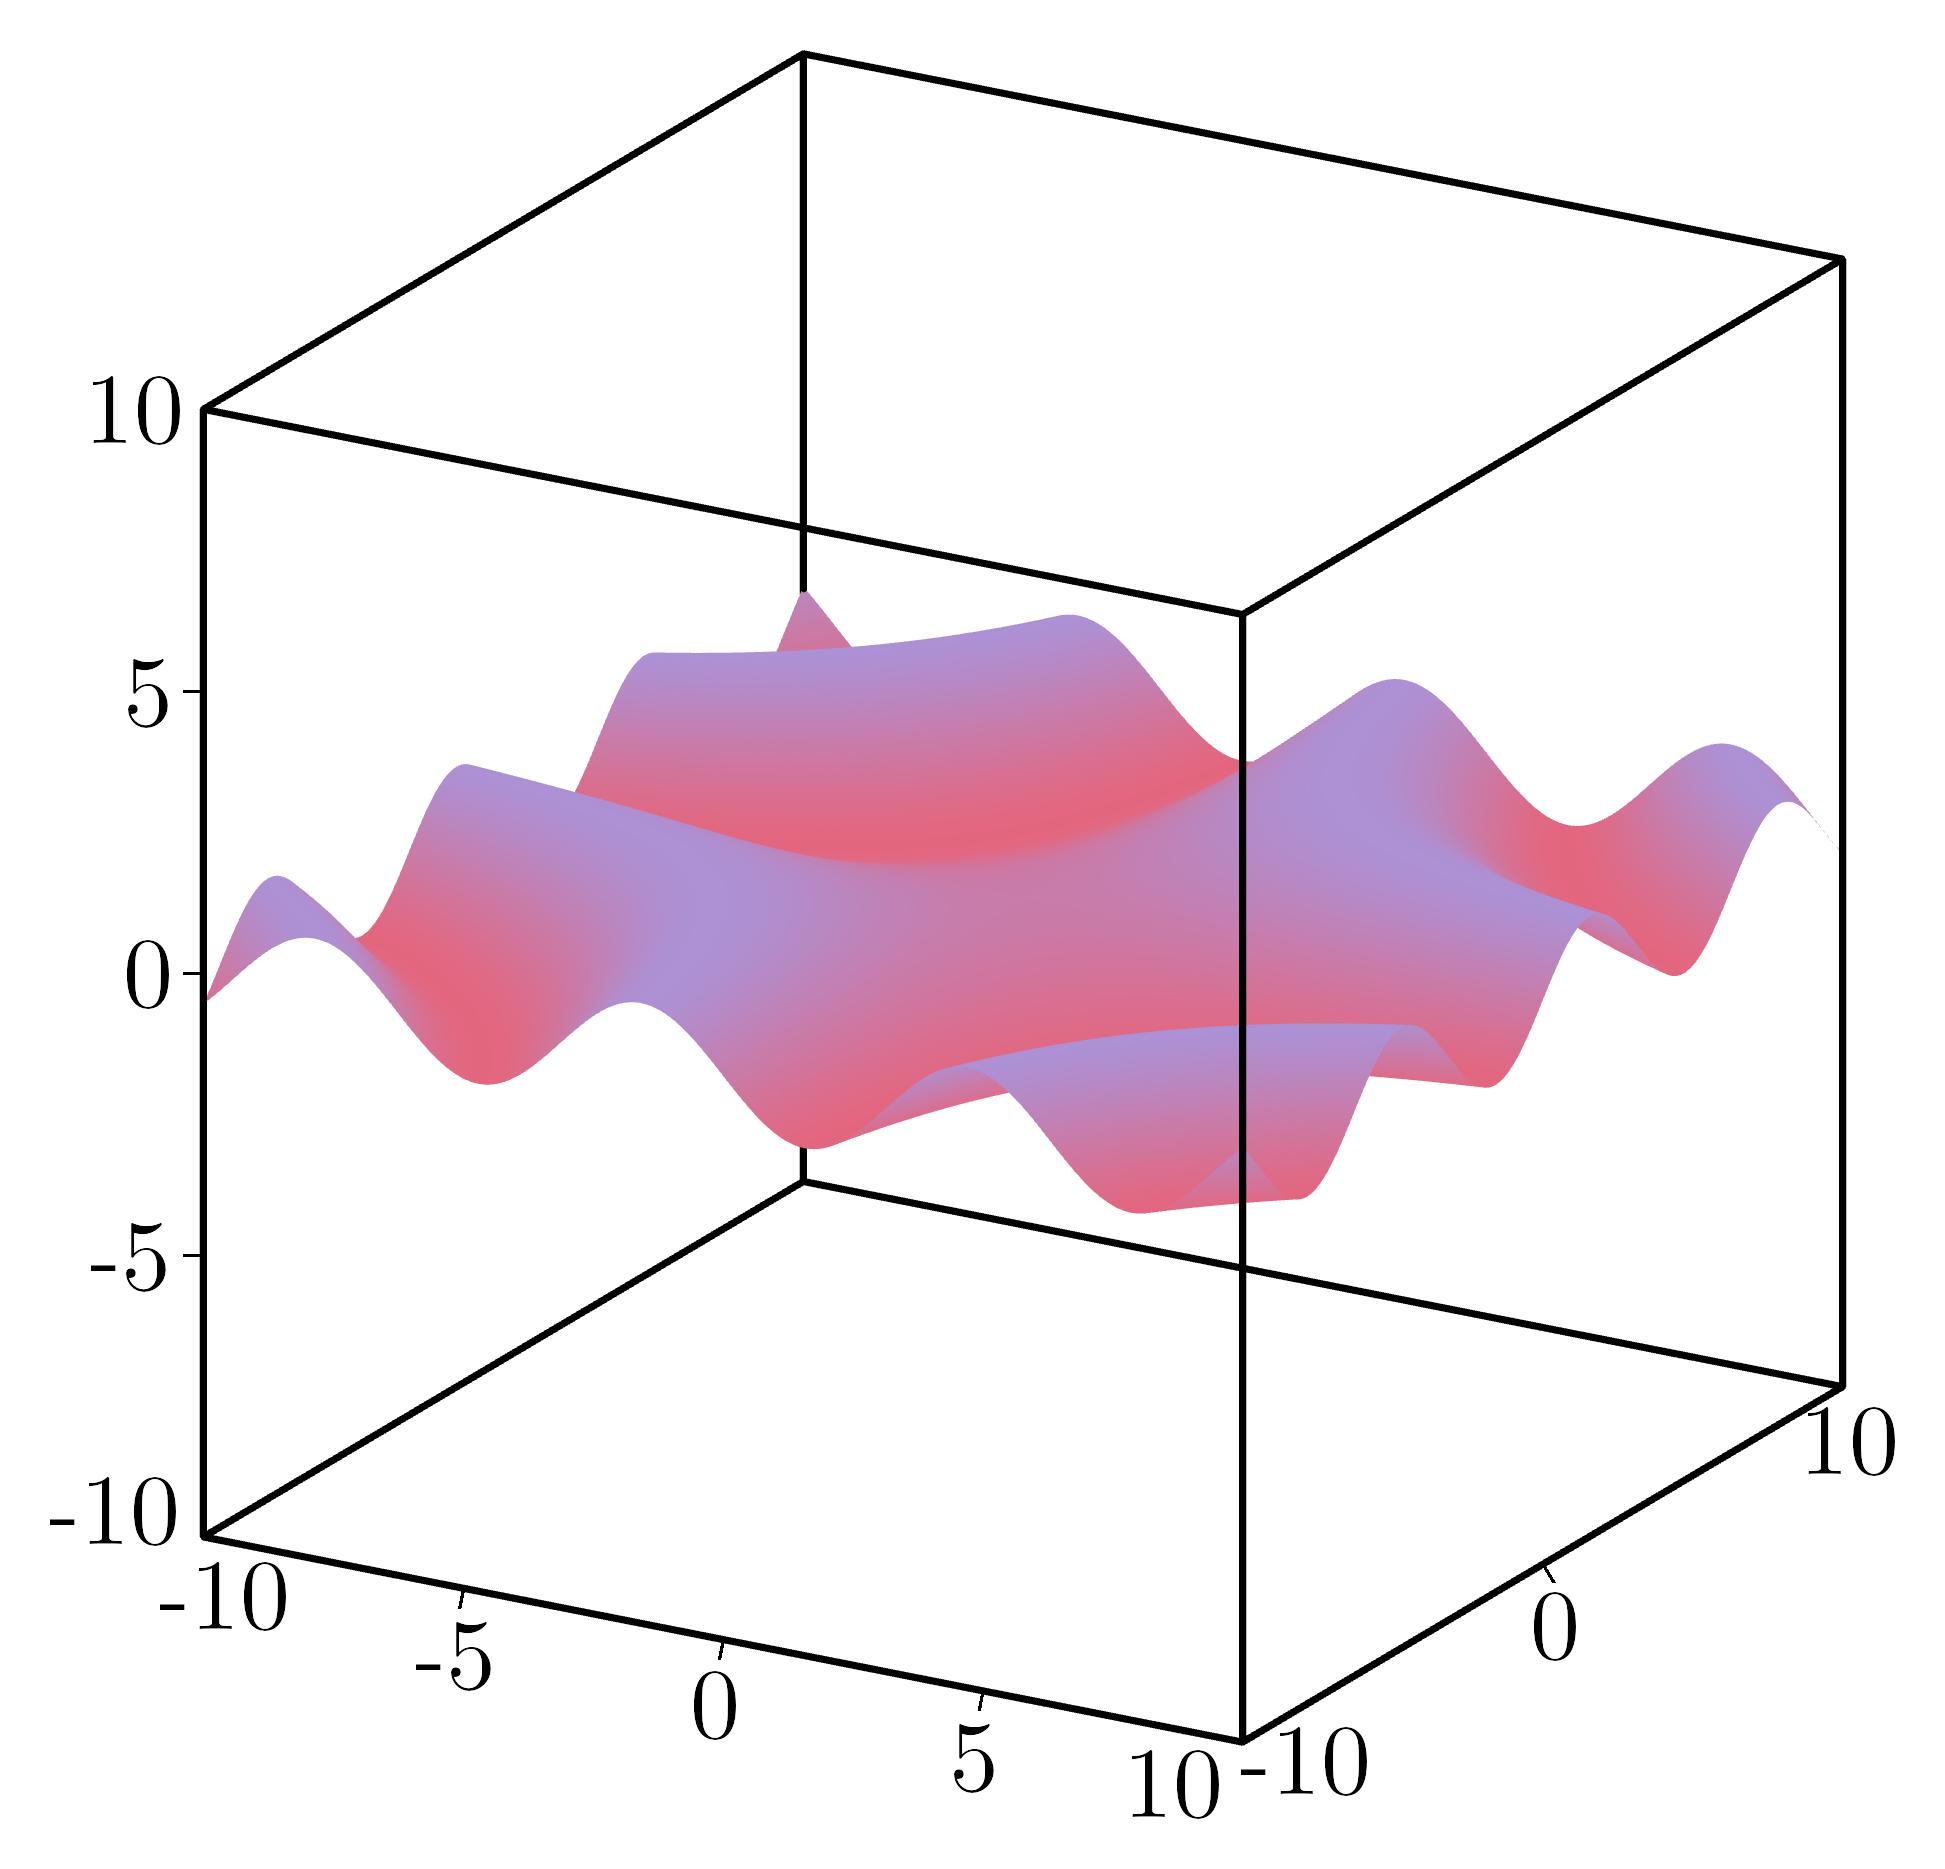
- bounds(plot_window=None, plot=None)
Estimate data bounds for auto-scaling 3D plots.
Returns
[x0, x1, y0, y1, z0, z1]withNonefor fixed axes.
- legend(text: str, color=None, symbol=None)
Adds a legend
- Parameters:
text (str) – The text to be displayed in the legend.
symbol (symbols, optional) – The symbol to be used in the legend.
color (optional) – The color to be used for the legend text. If not provided, the default color will be used.
- Returns:
self – Returns the instance of the arrow object with the updated legend.
- Return type:
object
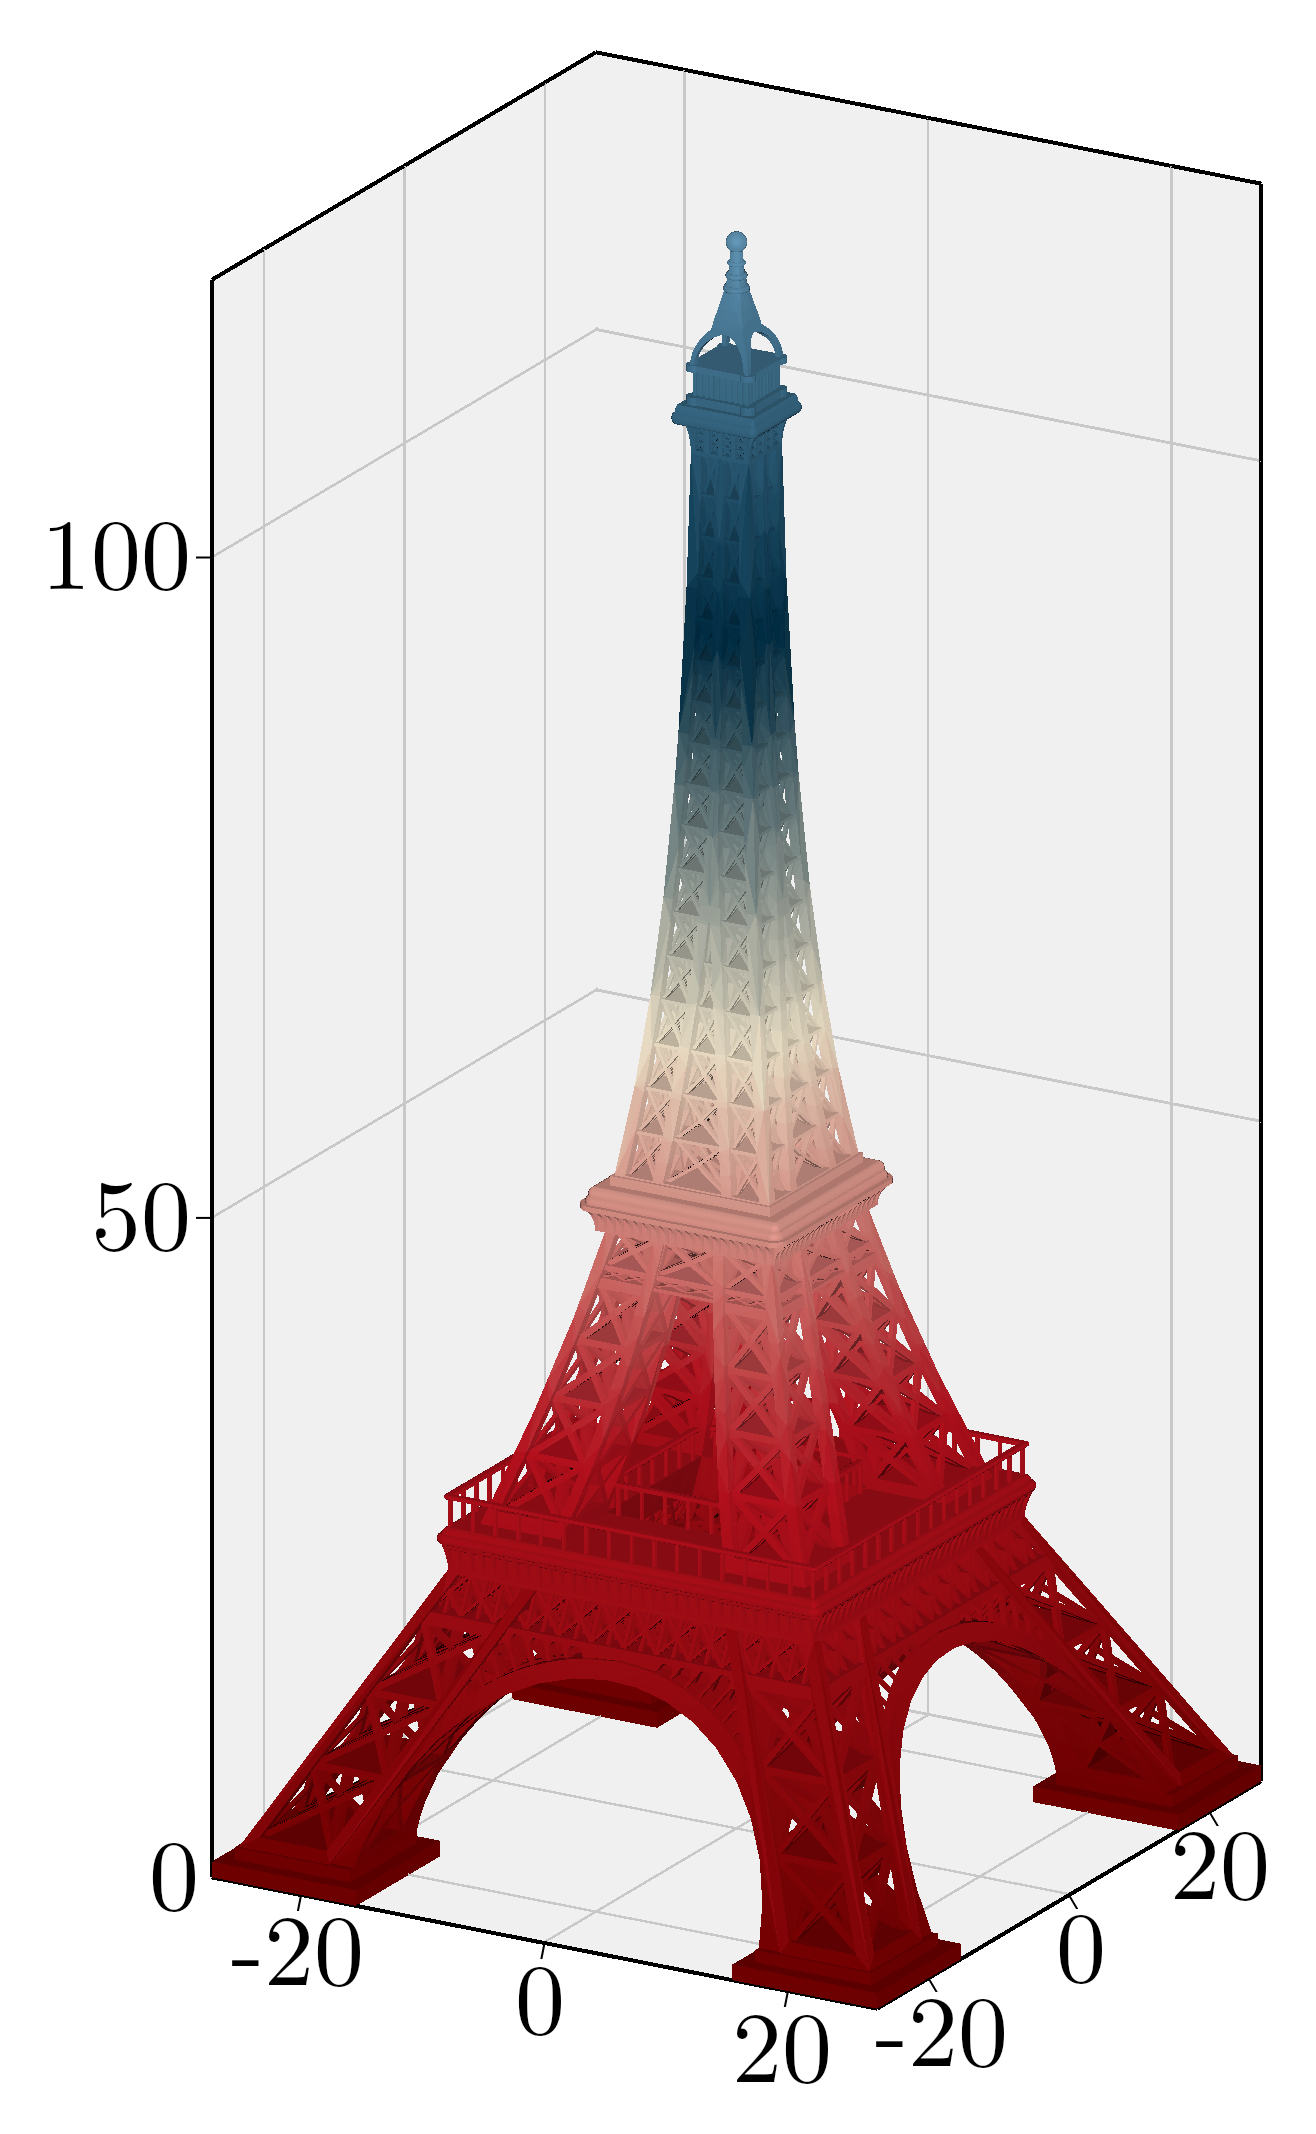
- class kaxe.Mesh(mesh, color: Colormap = None, excludeLight=False)
A class used to represent a 3D Mesh object.
- Parameters:
mesh (list or array-like) – The mesh object containing the 3D geometry. Contains all verticies data as three points.
color (Colormap, optional) – Colormap to display based on average vertices z-value for each triangle.
excludeLight (bool, optional) – Whether to exclude lighting effects. Default is True.
Examples
>>> mesh = kaxe.Mesh( meshlist )
>>> plt.add(mesh)
>>> mesh = kaxe.Mesh.open( 'path/to/mesh.stl' )
>>> plt.add(mesh)
- fromVectors(**kwargs)
Creates a mesh objects from vectors
- getBoundingBox()
gets the bounding box of the mesh
- Returns:
bbox – [x0, x1, y0, y1, z0, z1]
- Return type:
list
- legend(text: str, color=None, symbol=None)
Adds a legend
- Parameters:
text (str) – The text to be displayed in the legend.
symbol (symbols, optional) – The symbol to be used in the legend.
color (optional) – The color to be used for the legend text. If not provided, the default color will be used.
- Returns:
self – Returns the instance of the arrow object with the updated legend.
- Return type:
object
- open(**kwargs)
Reads a STL file and creates a Mesh object
- Parameters:
fpath (str) – file to STL-file. This method relies on the numpy-stl library.
color (Colormap, optional) – Colormap to display based on average vertices z-value for each triangle.
- Return type:
Examples
>>> mesh = kaxe.Mesh.open( 'path/to/mesh.stl' )
>>> plt.add(mesh)
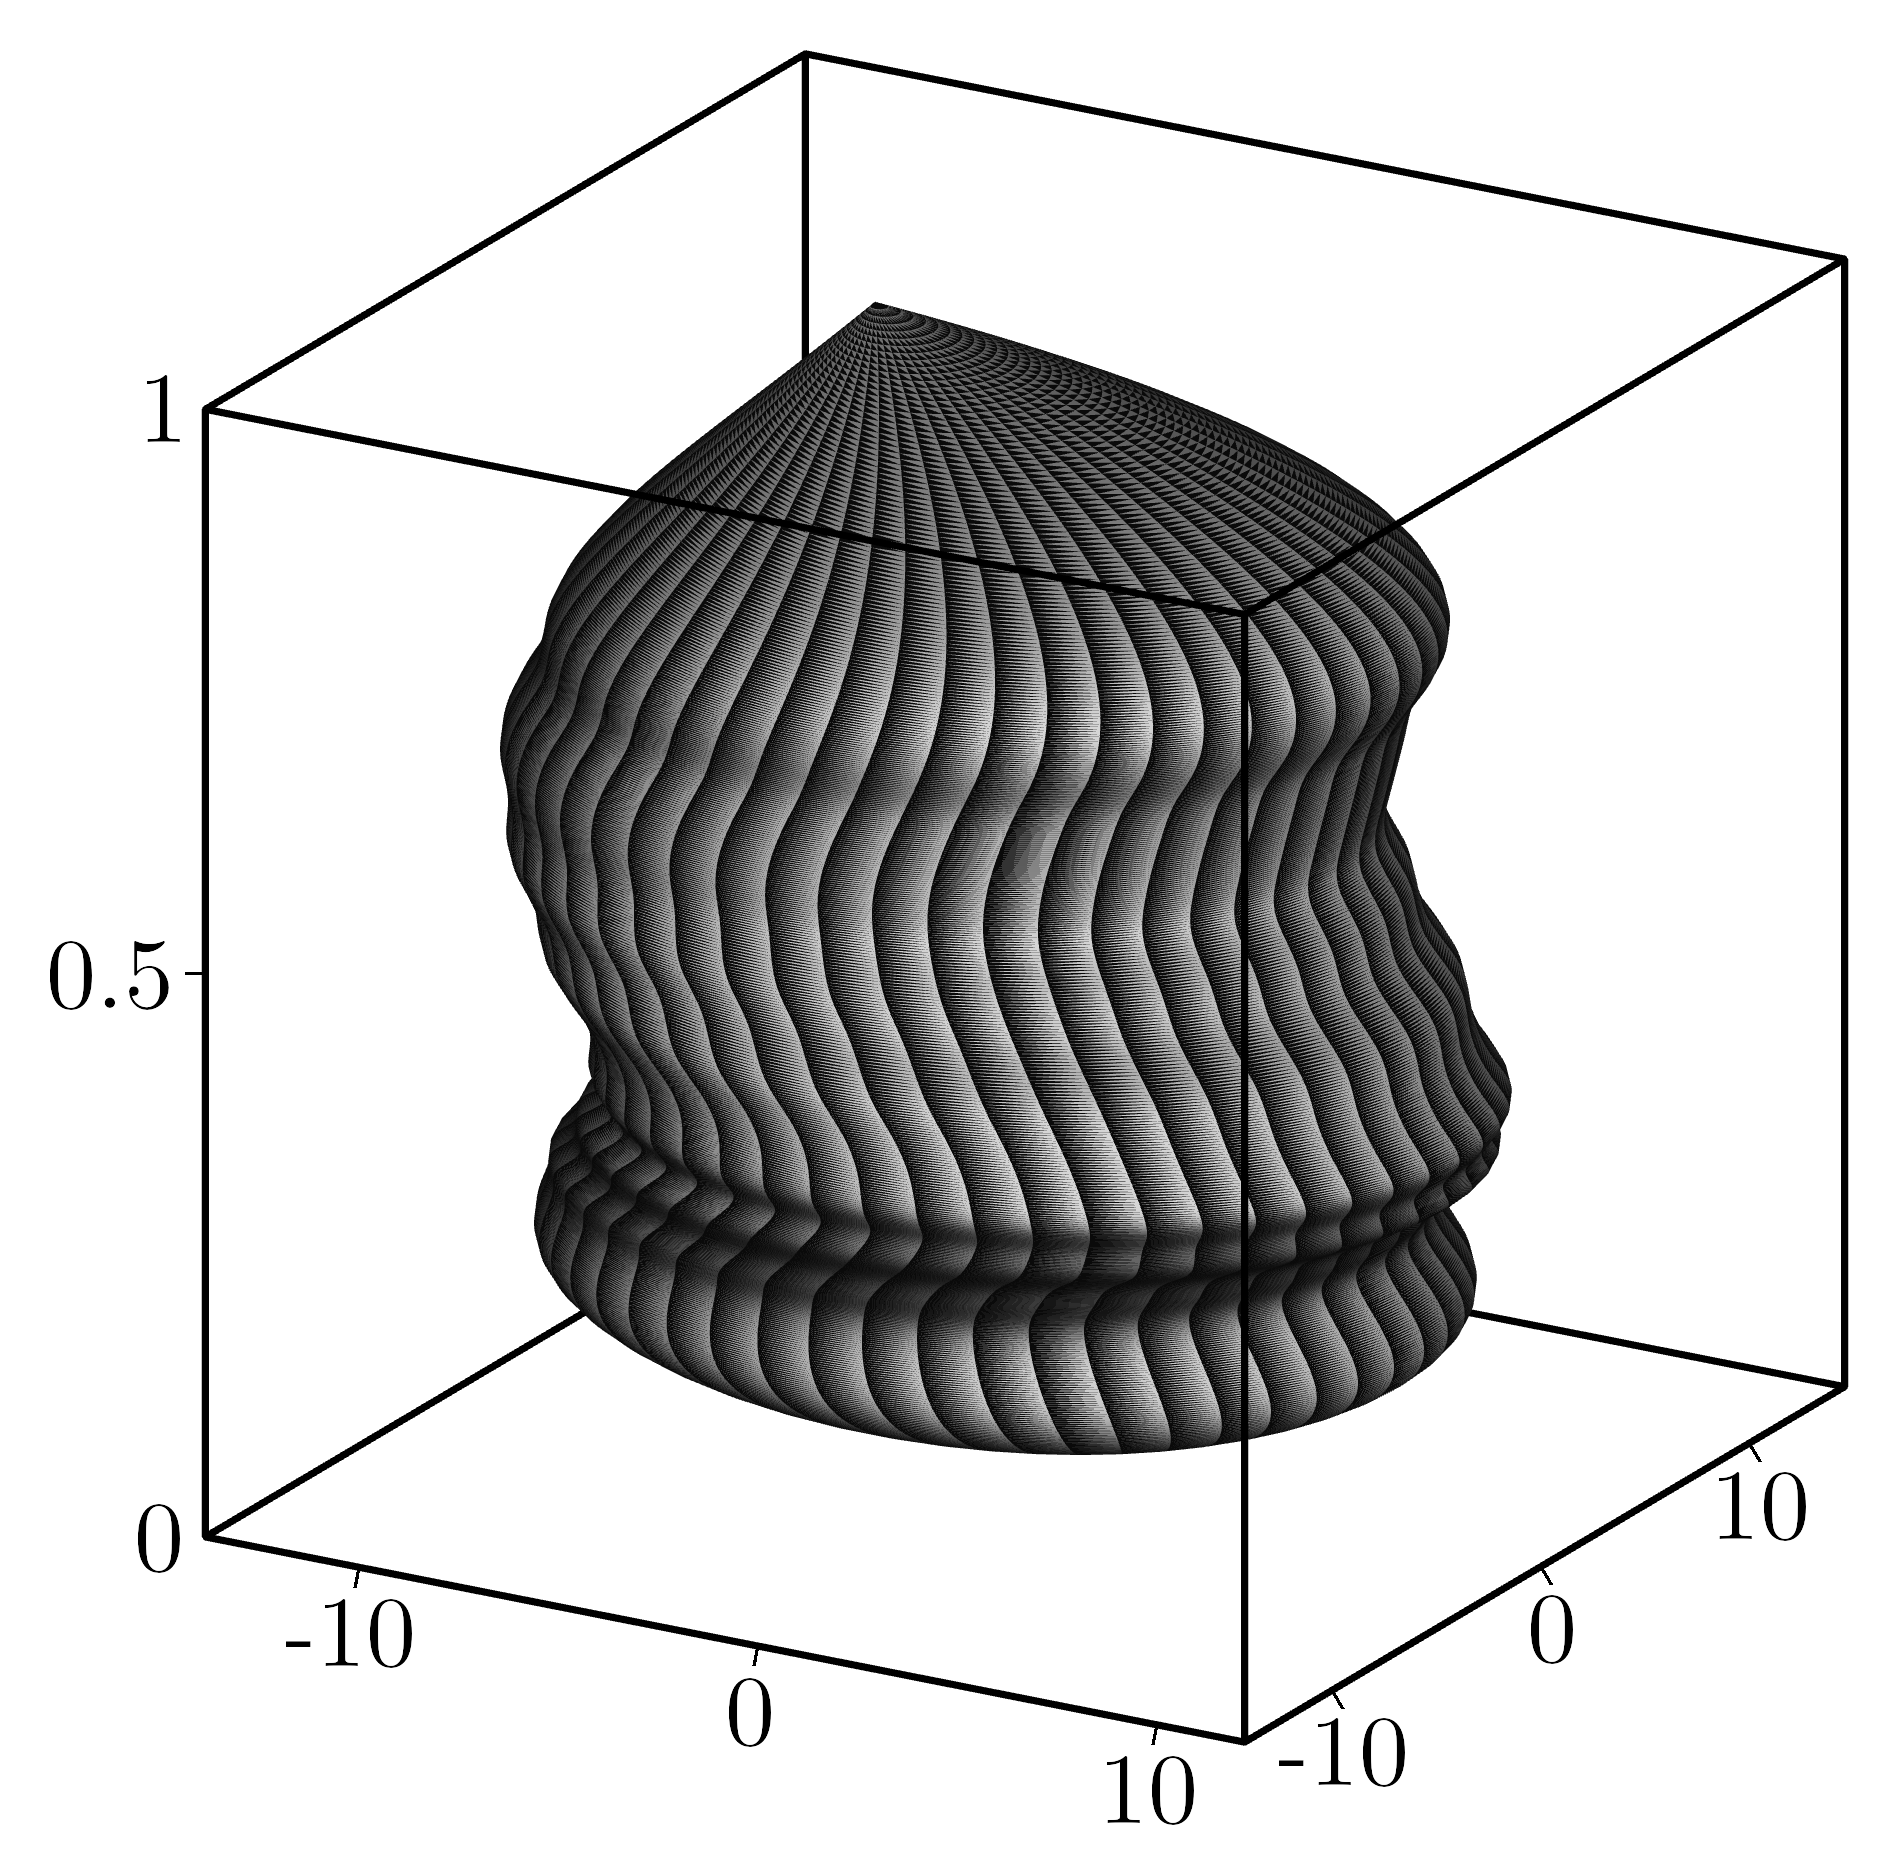
- class kaxe.Potato(xposfunc: LambdaType = None, yposfunc: LambdaType = None, radiusfunc: LambdaType = None, color: Colormap = None, height: float | int = 1, middelRadius: float | int = 10, spreadRadius: float | int = 0.5, spreadHorisontal: float | int = 10, numPointsHeight: int = 500, numRings=50)
A class used to generate a 3D potato-like mesh object by creating a series of rings and interpolating their positions and radii using cubic splines.
- Parameters:
xposfunc (FunctionType, optional) – A function to define the x-offset of the potato along its height. If None, a random spline is used.
yposfunc (FunctionType, optional) – A function to define the y-offset of the potato along its height. If None, a random spline is used.
radiusfunc (FunctionType, optional) – A function to define the radius of the potato along its height. If None, a random spline is used.
color (Colormap, optional) – The color map to apply to the mesh.
height (float or int, default=1) – The total height of the potato.
middelRadius (float or int, default=10) – The average radius of the potato.
spreadRadius (float or int, default=0.5) – The amount of randomness to apply to the radius.
spreadHorisontal (float or int, default=10) – The amount of randomness to apply to the horizontal offsets.
numPointsHeight (int, default=500) – The number of points to sample along the height of the potato.
numRings (int, default=50) – The number of rings to generate around the potato at each height level.
parameters (Create a potato mesh with default)
Examples
>>> potato = kaxe.Potato()
Create a potato mesh with custom radius and offset functions:
>>> from scipy.interpolate import CubicSpline
>>> import numpy as np
>>> z = np.linspace(0, 1, 10)
>>> x_offsets = np.sin(z * 2 * np.pi)
>>> y_offsets = np.cos(z * 2 * np.pi)
>>> radius = np.linspace(5, 10, 10)
>>> xposfunc = CubicSpline(z, x_offsets)
>>> yposfunc = CubicSpline(z, y_offsets)
>>> radiusfunc = CubicSpline(z, radius)
>>> potato = Potato(xposfunc=xposfunc, yposfunc=yposfunc, radiusfunc=radiusfunc)
Notes
The mesh is constructed by creating triangular faces between consecutive rings.
Randomness is introduced to create an organic, irregular shape.
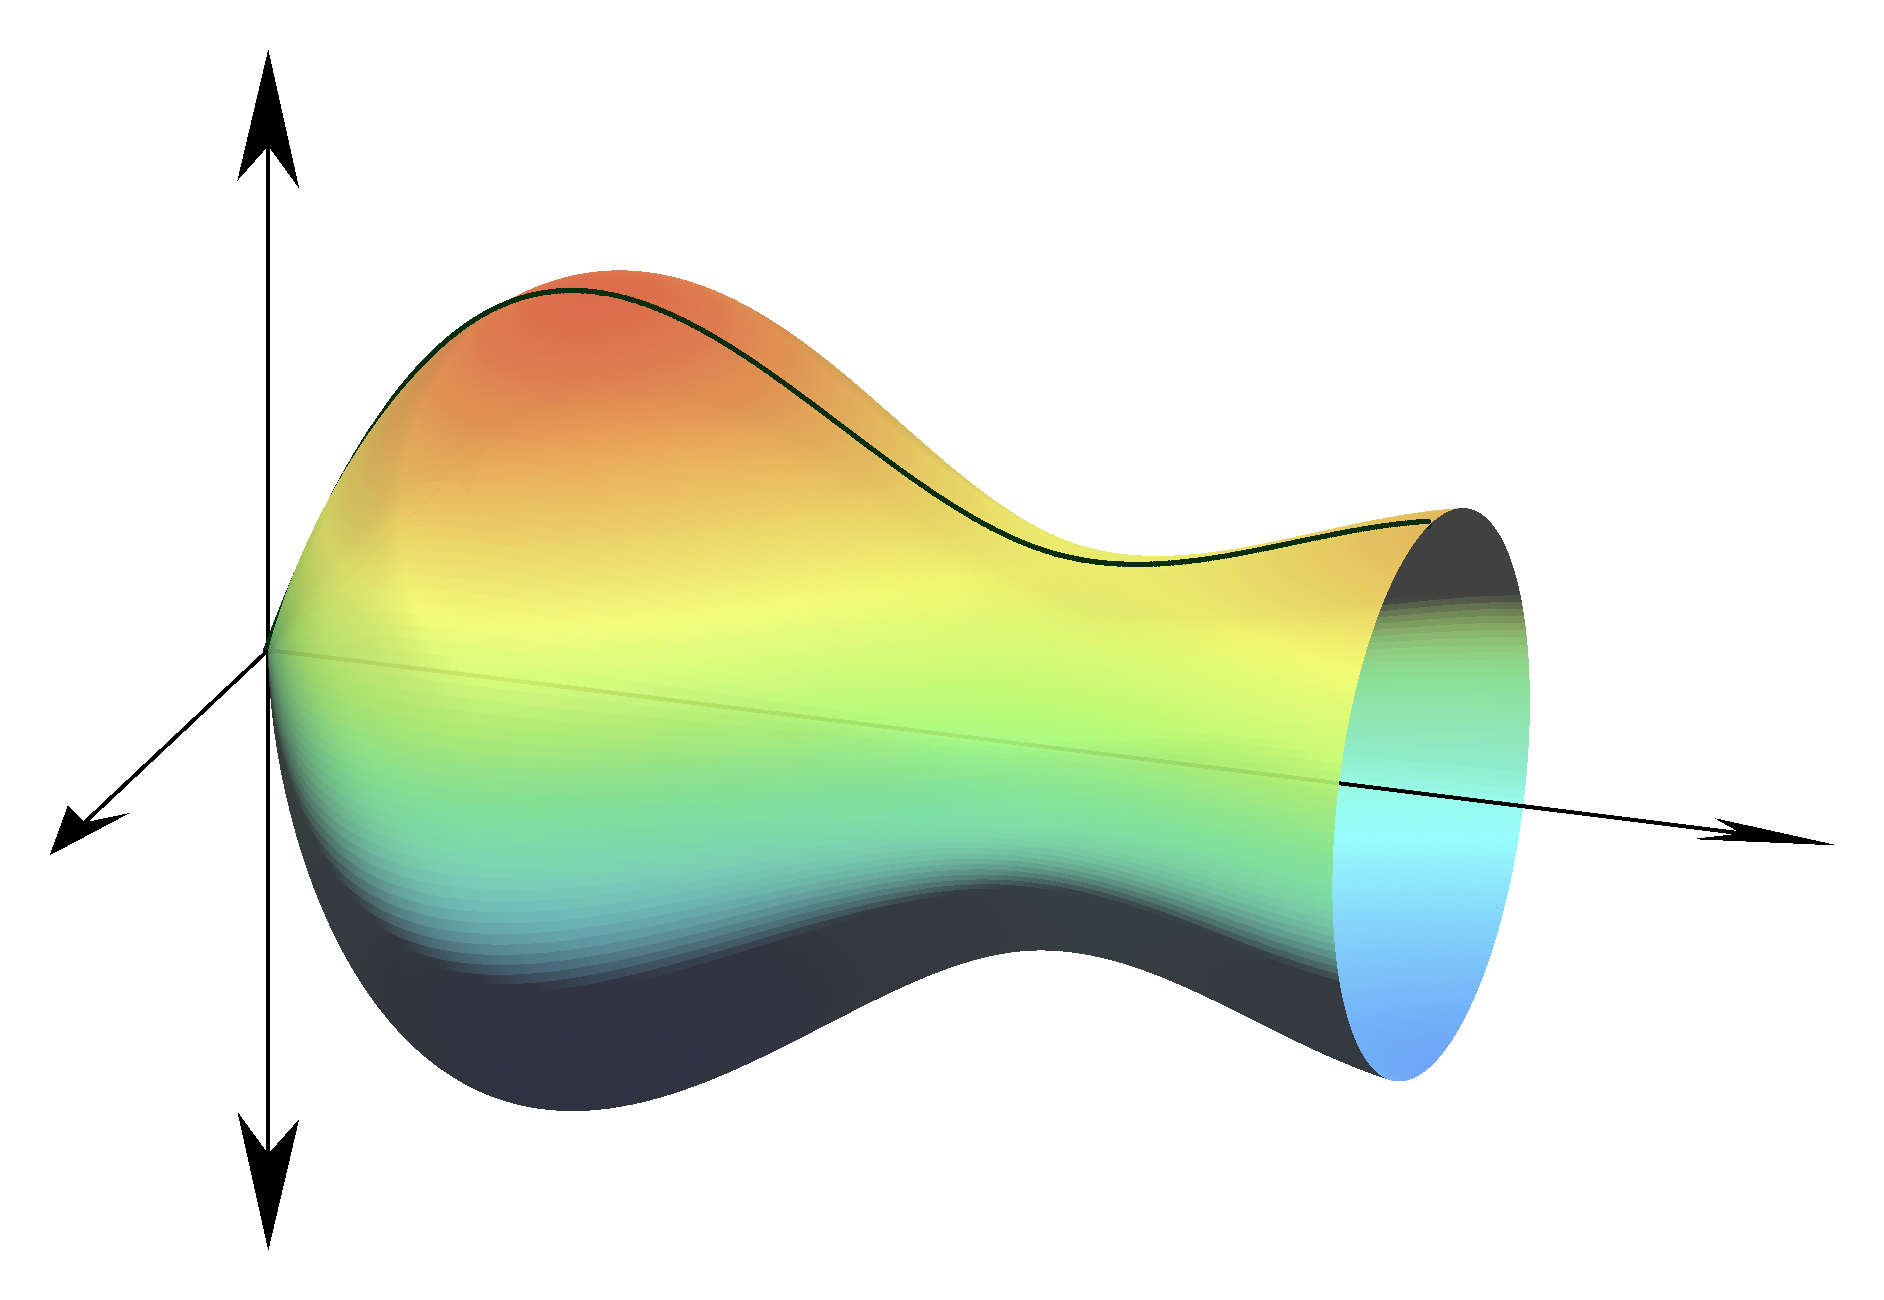
- class kaxe.SolidOfRotation(func: LambdaType, a: int | float, b: int | float, numPointsHeight=1000, numRings=180, axis=[0, -1, 0], color: Colormap = None)
A class representing a solid of rotation, which is a 3D object generated by rotating a 2D curve (defined by a function) around an axis.
- Parameters:
func (FunctionType) – A function defining the radius of the solid at a given height.
a (int or float) – The lower bound of the height range for the solid of rotation.
b (int or float) – The upper bound of the height range for the solid of rotation.
numPointsHeight (int, optional) – The number of points used to discretize the height of the solid (default is 1000).
numRings (int, optional) – The number of rings used to approximate the solid of rotation (default is 180).
axis (list of int, optional) – The axis of rotation, represented as a 3D vector (default is [0, -1, 0]).
color (Colormap, optional) – The colormap used to color the solid of rotation (default is None).
Notes
The solid is generated by rotating the given function func around the specified axis. The rotation is performed by rotating the mesh by 90 degrees around the given axis.
Examples
>>> from some_module import SolidOfRotation
>>> import math
>>> solid = SolidOfRotation(
...     func=lambda x: math.sin(x),
...     a=0,
...     b=math.pi,
...     numPointsHeight=500,
...     numRings=100,
...     axis=[0, -1, 0],
...     color=None
... )